The Intel Xeon W Review: W-2195, W-2155, W-2123, W-2104 and W-2102 Tested
by Ian Cutress & Joe Shields on July 30, 2018 1:00 PM EST- Posted in
- CPUs
- Intel
- Xeon
- Workstation
- ECC
- Skylake-SP
- Skylake-X
- Xeon-W
- Xeon Scalable
Benchmarking Performance: CPU System Tests
Our first set of tests is our general system tests. These set of tests are meant to emulate more about what people usually do on a system, like opening large files or processing small stacks of data. This is a bit different to our office testing, which uses more industry standard benchmarks, and a few of the benchmarks here are relatively new and different.
All of our benchmark results can also be found in our benchmark engine, Bench.
FCAT Processing: link
One of the more interesting workloads that has crossed our desks in recent quarters is FCAT - the tool we use to measure stuttering in gaming due to dropped or runt frames. The FCAT process requires enabling a color-based overlay onto a game, recording the gameplay, and then parsing the video file through the analysis software. The software is mostly single-threaded, however because the video is basically in a raw format, the file size is large and requires moving a lot of data around. For our test, we take a 90-second clip of the Rise of the Tomb Raider benchmark running on a GTX 980 Ti at 1440p, which comes in around 21 GB, and measure the time it takes to process through the visual analysis tool.
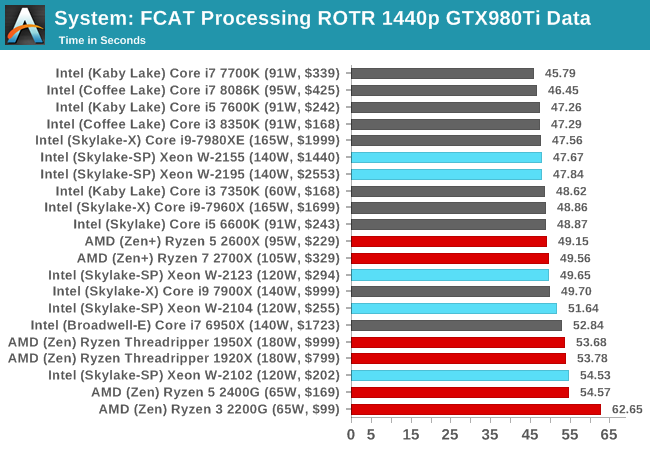
FCAT likes single threaded performance, whcih shows the high frequency parts with faster memory near the top.
Dolphin Benchmark: link
Many emulators are often bound by single thread CPU performance, and general reports tended to suggest that Haswell provided a significant boost to emulator performance. This benchmark runs a Wii program that ray traces a complex 3D scene inside the Dolphin Wii emulator. Performance on this benchmark is a good proxy of the speed of Dolphin CPU emulation, which is an intensive single core task using most aspects of a CPU. Results are given in minutes, where the Wii itself scores 17.53 minutes.
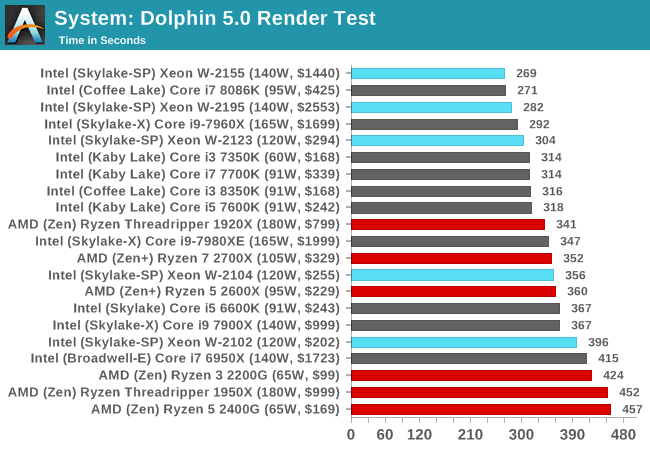
Dolphin is also pure ST frequency driven, however a surprise twist in that our Xeon W-2155 beats the Core i7-8086K in this test, although with a margin of error.
3D Movement Algorithm Test v2.1: link
This is the latest version of the self-penned 3DPM benchmark. The goal of 3DPM is to simulate semi-optimized scientific algorithms taken directly from my doctorate thesis. Version 2.1 improves over 2.0 by passing the main particle structs by reference rather than by value, and decreasing the amount of double->float->double recasts the compiler was adding in. It affords a ~25% speed-up over v2.0, which means new data.
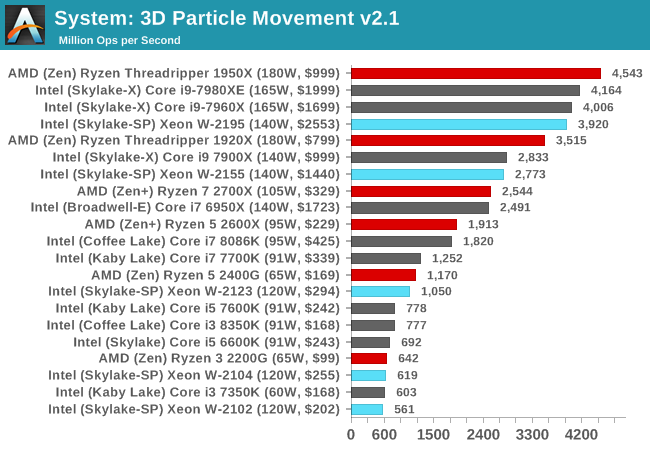
3DPM likes fast cache and frequency, and the W-2195 is almost fighting with the Core i9-7980XE here, and is let down slightly by its slow memory. The 1950X is still top dog.
DigiCortex v1.20: link
Despite being a couple of years old, the DigiCortex software is a pet project for the visualization of neuron and synapse activity in the brain. The software comes with a variety of benchmark modes, and we take the small benchmark which runs a 32k neuron/1.8B synapse simulation. The results on the output are given as a fraction of whether the system can simulate in real-time, so anything above a value of one is suitable for real-time work. The benchmark offers a 'no firing synapse' mode, which in essence detects DRAM and bus speed, however we take the firing mode which adds CPU work with every firing.
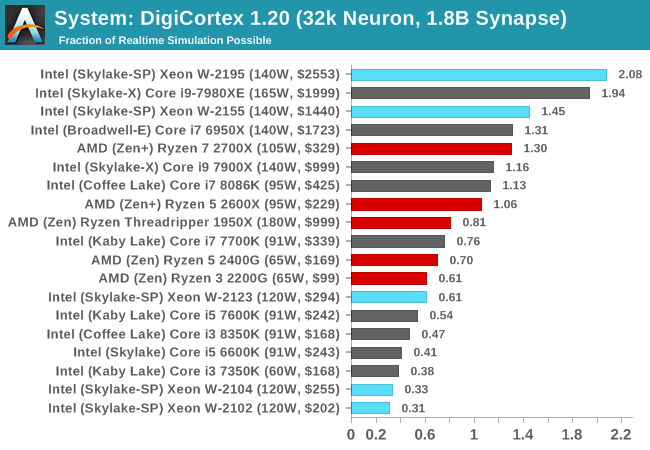
DigiCortex is a memory focused benchmark, but can also take advantage of AVX2 and sometimes AVX512, hence why the W-2195 is sat at the top. That being said, it is above the i9-7980XE, despite the latter having dual AVX512 ports.
Agisoft Photoscan 1.3.3: link
Photoscan stays in our benchmark suite from the previous version, however now we are running on Windows 10 so features such as Speed Shift on the latest processors come into play. The concept of Photoscan is translating many 2D images into a 3D model - so the more detailed the images, and the more you have, the better the model. The algorithm has four stages, some single threaded and some multi-threaded, along with some cache/memory dependency in there as well. For some of the more variable threaded workload, features such as Speed Shift and XFR will be able to take advantage of CPU stalls or downtime, giving sizeable speedups on newer microarchitectures.
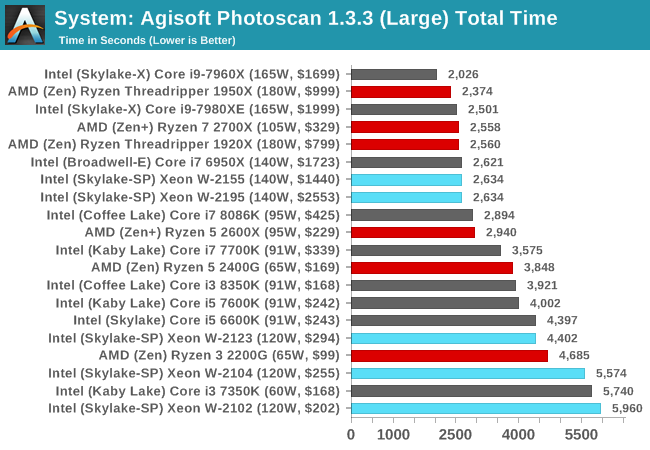
Agisoft is a mixture of workloads, although the big multithreaded bit in the middle tends to dominate. Both the W-2195 and W-2155 score the same time, with a cluster of results around it. The Core i9-7960X sits on top though, with a seemingly better mix of cores and threads.


74 Comments
View All Comments
mode_13h - Monday, July 30, 2018 - link
Just the fact that you need to map your VMs to stay on the same physical core, for best performance (i.e. so that the memory is local to it). If you do that, TR is actually a great VM solution.Death666Angel - Monday, July 30, 2018 - link
That doesn't sound so complicated as to be a "situation" for someone dealing with VMs. :) Seems like a general setup config thing that you just check off when you do it once.mode_13h - Tuesday, July 31, 2018 - link
Sorry, I meant "same physical die". Actually, best results are from setting affinity at the CCX (i.e. 4-core) granularity.SanX - Tuesday, July 31, 2018 - link
The day ARM announced it developed 8 and 16-core server and supercomputer chips at their usual price around $25 per 5 billion transistors, Intel Xeon prices would plunge 10-50x.Infy2 - Monday, July 30, 2018 - link
It would be helpful on those charts if there was an indicator how many cores/threads in CPU has.Ian Cutress - Monday, July 30, 2018 - link
We used to have that info in the graphs, however people found it redundant when it was elsewhere, and price/power was requested instead. It's hard to put all the info of every part into every graph!Death666Angel - Monday, July 30, 2018 - link
Can that not be coded as a tooltip/mouse-over text? That would be neat and not add clutter while adding information to those who want it. :)Ian Cutress - Monday, July 30, 2018 - link
Graphs are images generated locally from the data. I'm not au fait with how our back end works, but that's require more than a simple rewriteDeath666Angel - Tuesday, July 31, 2018 - link
Alright. :) Shame though, would be a useful feature for some. Maybe add it to an overhaul list, if such a thing exists. :)lkuzmanov - Tuesday, July 31, 2018 - link
I'm with Infy2 on this one, not sure who protested, but I think something like (10/20) next to the model wouldn't be too distracting or cost too much screen space. I caught myself having to go back to the first page of the article to check the core count of the Xeon parts. That said - great content, you're one of my daily go-to sites.