Smartphone Audio Quality Testing
by Chris Heinonen on December 8, 2013 5:15 PM EST- Posted in
- Smartphones
- Audio
- Mobile
- Tablets
- Testing
THD+N is a measure of the total harmonic distortion and noise compared to the signal. The lower the number, the less distortion and noise there is relative to the fundamental frequency. THD+N is measured by driving a 1 kHz sine wave at maximum volume. Because there is always some inherent background noise, the THD+N is almost always lowest at maximum output so that is used for the measurement.
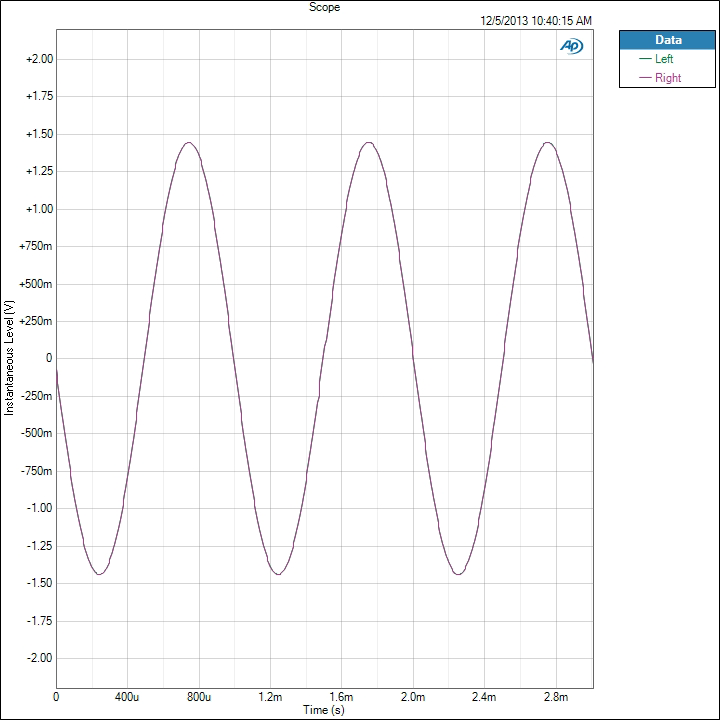
There are two results that we take from this: a sine wave and a FFT spectrum. On the sine wave both channels should line up perfectly, and it should be as close to an accurate sine wave as possible. On the FFT we want to see a peak at 1 kHz and everything else as low as possible. The most common artifact you will see are harmonic sidebands at multiples of 1 kHz.
For an example of data that looks good, here is the sine wave of the iPhone 5. We see a sine wave that is good, with channels that overlap perfectly and no deviation. This is what we expect to see.
Now for a different example we look at the Nexus 5. Run at maximum volume we see that the left channel is clipping in the sine wave. Likely the power to the headphone amplifier is not enough to drive both channels and so this is the result. UPDATE: Tested this with 4.4.1 and no change.
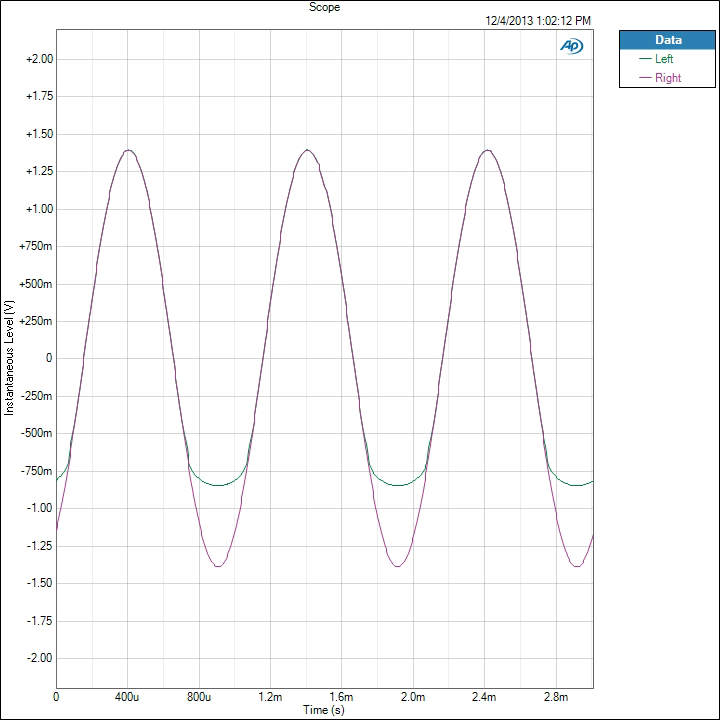
The iPhone 5 produces a THD+N ratio of 0.003134% while because of the clipping, the Nexus 5 is producing 13.789197%. Any level over 1% is considered to be past the clipping point of an amplifier and it seems that the Nexus 5 cannot be driven at maximum volume. I tested two samples to verify, and on both the performance is identical.
Now if we look at the FFT for this test, we see how this distortion is showing up. First, the iPhone 5 is very quiet.
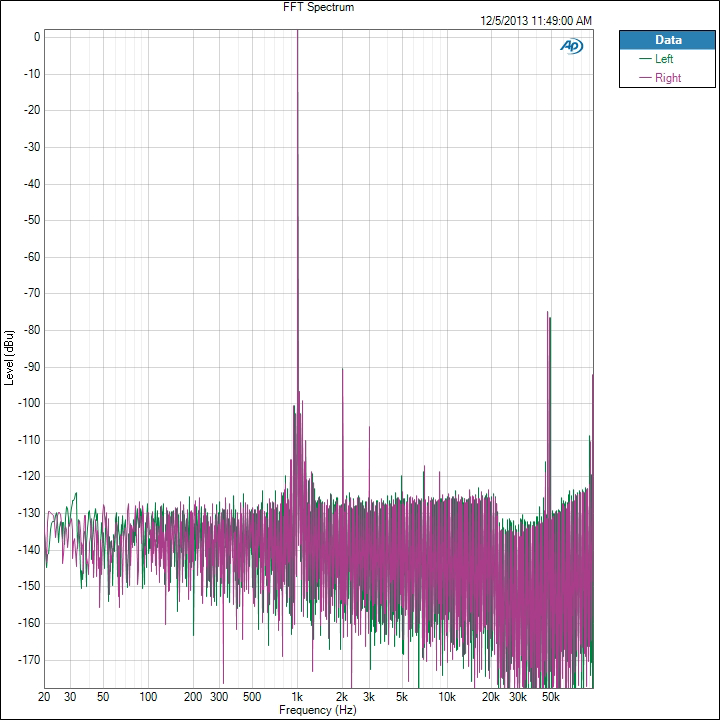
There is a 2 kHz peak that is -93 dB below the fundamental frequency, and the 3rd harmonic at 3 kHz is over -109 dB below it. All the harmonics past that are at -120 dB below the fundamental tone. There is some noise out at 50 kHz but this is so far past the level of human hearing that it is safely ignored. Now the Nexus 5 FFT.
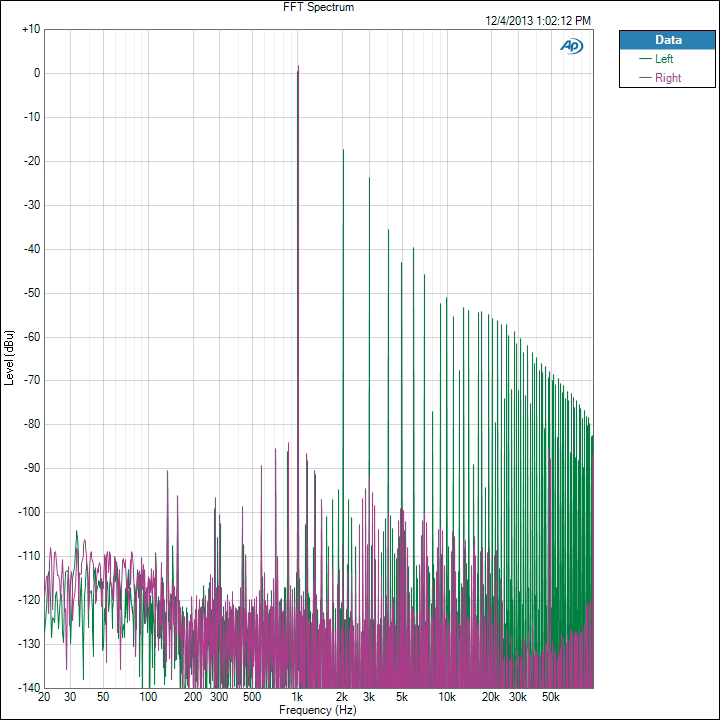
We see the right channel, which didn’t clip, looks good. The 2nd harmonic is -111 dB and the 3rd harmonic is -93 dB. On the left channel the 2nd harmonic is only -18 dB and the 3rd harmonic is -24 dB. Even at the 9th harmonic we are still only -52 dB below the fundamental tone. This is causing these incredibly high THD+N numbers that we are seeing on the Nexus 5. We will see more detail of this on a later test as well.
We also chart THD+N vs. Frequency. Here is the chart for the Note 3.
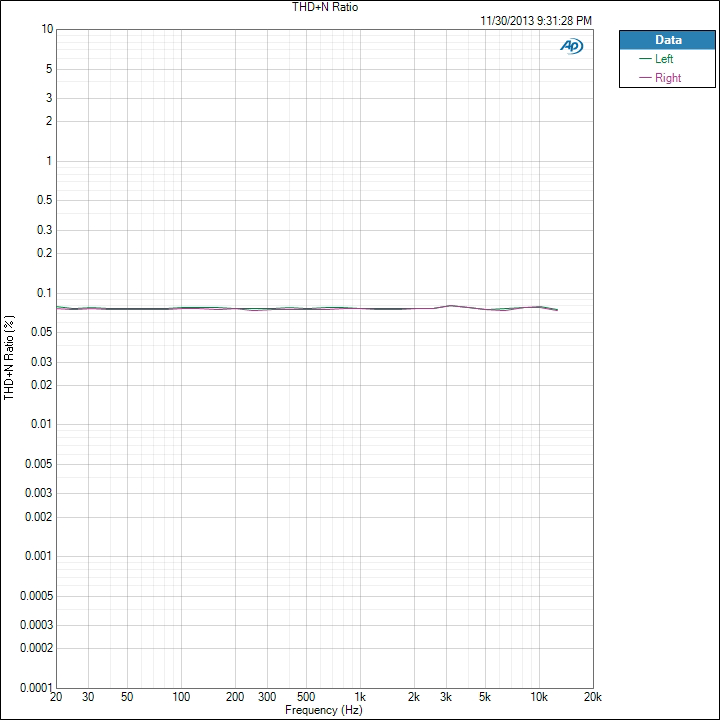
We see that THD+N is basically right below 0.08% for the whole spectrum. It moves up and down slightly, but is very constant. Now here is that Nexus 5 data.
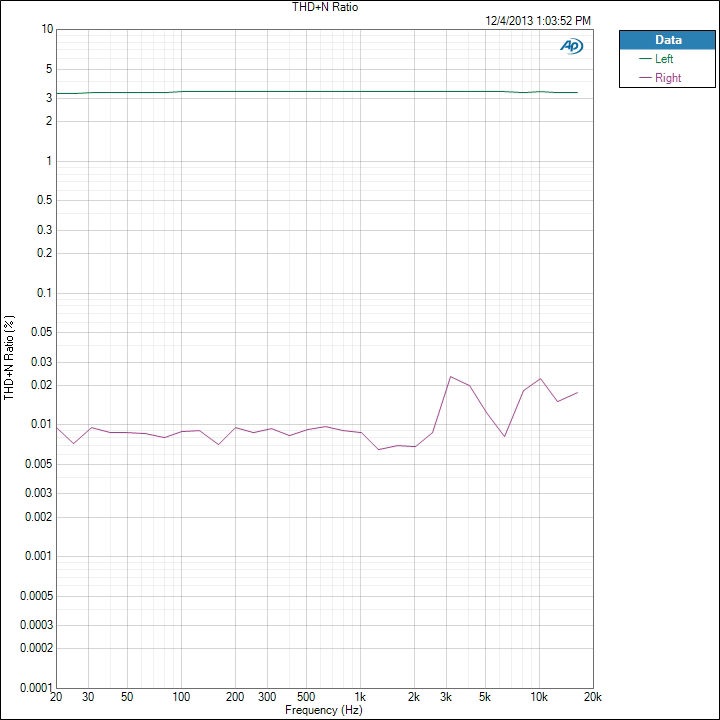
We see that the right channel is around 0.01% THD+N while the left channel, the clipped one, is over 3%. If we ran the Nexus 5 at a lower volume level we would see totally different results, as you’ll find out later, but this is how devices are typically measured.


188 Comments
View All Comments
Impulses - Monday, December 9, 2013 - link
All great suggestions IMO.haukionkannel - Tuesday, December 10, 2013 - link
I allso agree. Maximum volume level is not the same as guality, you have to find measures that are relevant in normal listening volumes. They vary yeas and depends a lot of used headphones. So I would allso recommended of using headphones with different impedanses! One pair of high impedance hifi headphones. One pair of low impedance hifi headphones and one pair of high guality (but commonly used) low impedance headphones.Otherwise it would be like testing 780 triple sli setup using 320p resolution mini monitor...
(Well actually not likely because phones have not been very high guality sound sourses, but I think that you got the point.) Good sound qaulity is important factor to me, so I am very eager to hear more (pun inteded ;-) about these test and allso the results!
DaveSimmons - Monday, December 9, 2013 - link
Thanks for doing this. When my 120 GB iPod dies I'll probably replace it with a smartphone or tablet, so this will help me choose which one to use.estarkey7 - Monday, December 9, 2013 - link
As others have stated, and I will reiterate, Only Anandtech! Bravo!I would love to see a similar article comparing HD Voice for the carriers. I know that test may be more difficult to conduct, but ever since Sprint hyped their HD Voice and didn't deliver, I'd like to see some real engineers do the topic justice.
hlovatt - Monday, December 9, 2013 - link
Congratulations AnandTech, yet again you show the rest of the review industry what they should be doing. Keep up the good work and it should be fascinating to see the full set of results. Thanks.willis936 - Monday, December 9, 2013 - link
Is there any comment on the practical issue of noise at low volumes? Noise floor testing is uncommon but phones are noisy and are typically listened to with sensitive buds. Who cares it'd the dynamic range is 100dB if you never turn the volume up past 30%?pr1mal0ne - Monday, December 9, 2013 - link
I disagree with you testing all phones at maximum volume level1) the max volume differs, some companies may reasonably make the choice to let quality suffer while volume improves. at the least volume needs to be reported alongside these quality discussions. Preferably it would be set to a base volume and tested there.
Tuxedo - Monday, December 9, 2013 - link
Amazing article. I have always been impressed with audio quality on iPhones and disappointed with GS2, GS3, Atrix, Lumia 900 and now OG-Pro. Really shows how much attention Apple pays to the products they build.edwh - Monday, December 9, 2013 - link
what about output impedance?fishjunk - Monday, December 9, 2013 - link
I don't really use the audio jack on my Nexus 5. Are there any tests done on the phone mic and speakers.