Smartphone Audio Quality Testing
by Chris Heinonen on December 8, 2013 5:15 PM EST- Posted in
- Smartphones
- Audio
- Mobile
- Tablets
- Testing
THD+N is a measure of the total harmonic distortion and noise compared to the signal. The lower the number, the less distortion and noise there is relative to the fundamental frequency. THD+N is measured by driving a 1 kHz sine wave at maximum volume. Because there is always some inherent background noise, the THD+N is almost always lowest at maximum output so that is used for the measurement.
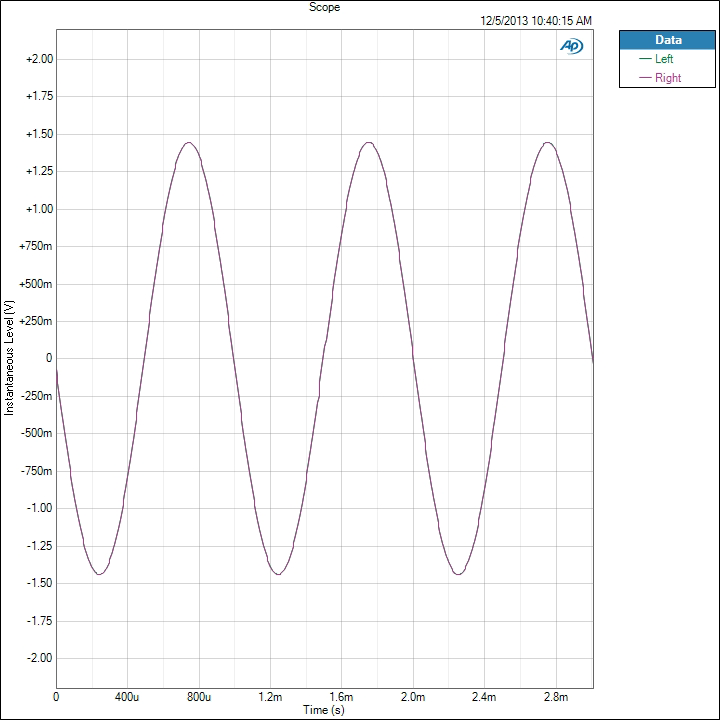
There are two results that we take from this: a sine wave and a FFT spectrum. On the sine wave both channels should line up perfectly, and it should be as close to an accurate sine wave as possible. On the FFT we want to see a peak at 1 kHz and everything else as low as possible. The most common artifact you will see are harmonic sidebands at multiples of 1 kHz.
For an example of data that looks good, here is the sine wave of the iPhone 5. We see a sine wave that is good, with channels that overlap perfectly and no deviation. This is what we expect to see.
Now for a different example we look at the Nexus 5. Run at maximum volume we see that the left channel is clipping in the sine wave. Likely the power to the headphone amplifier is not enough to drive both channels and so this is the result. UPDATE: Tested this with 4.4.1 and no change.
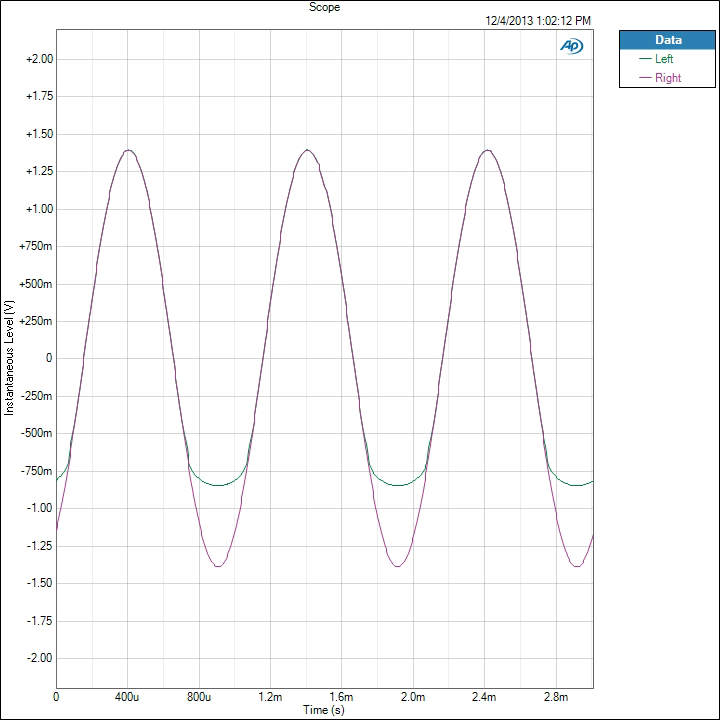
The iPhone 5 produces a THD+N ratio of 0.003134% while because of the clipping, the Nexus 5 is producing 13.789197%. Any level over 1% is considered to be past the clipping point of an amplifier and it seems that the Nexus 5 cannot be driven at maximum volume. I tested two samples to verify, and on both the performance is identical.
Now if we look at the FFT for this test, we see how this distortion is showing up. First, the iPhone 5 is very quiet.
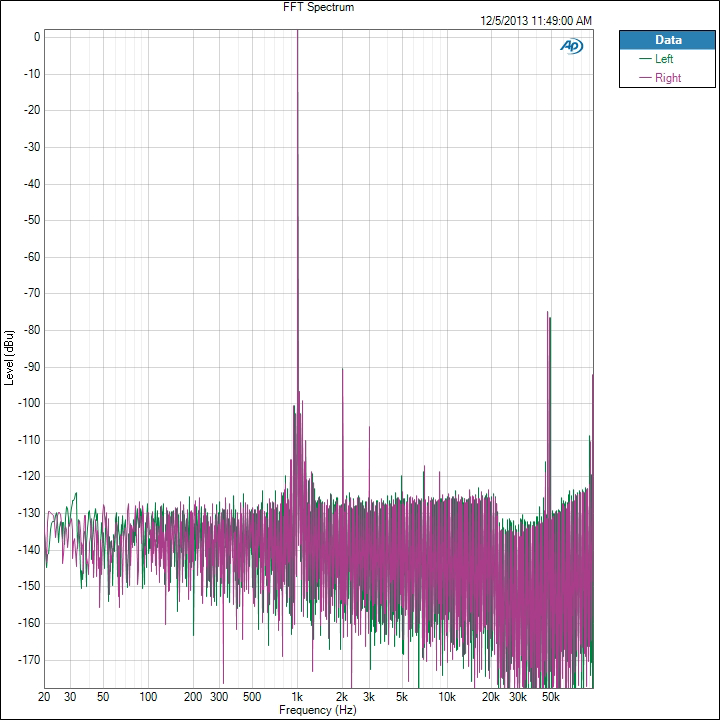
There is a 2 kHz peak that is -93 dB below the fundamental frequency, and the 3rd harmonic at 3 kHz is over -109 dB below it. All the harmonics past that are at -120 dB below the fundamental tone. There is some noise out at 50 kHz but this is so far past the level of human hearing that it is safely ignored. Now the Nexus 5 FFT.
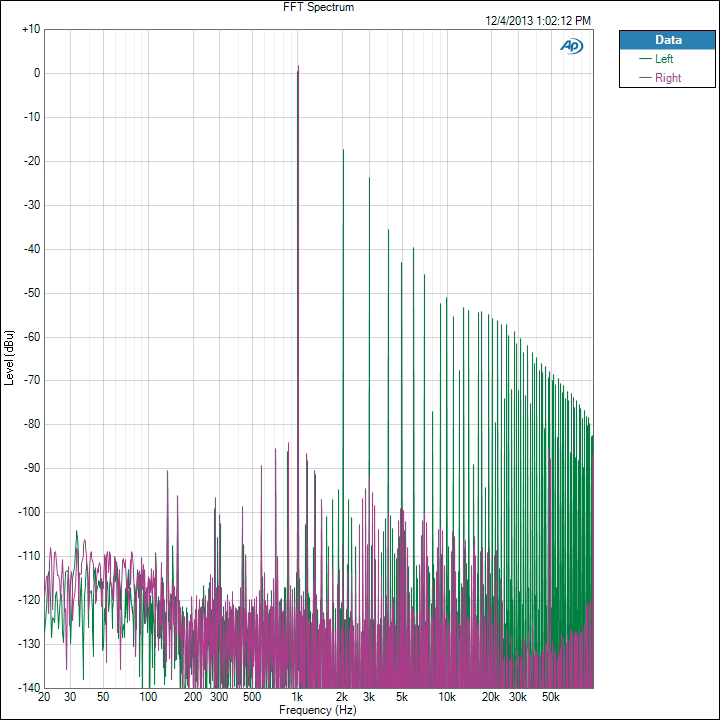
We see the right channel, which didn’t clip, looks good. The 2nd harmonic is -111 dB and the 3rd harmonic is -93 dB. On the left channel the 2nd harmonic is only -18 dB and the 3rd harmonic is -24 dB. Even at the 9th harmonic we are still only -52 dB below the fundamental tone. This is causing these incredibly high THD+N numbers that we are seeing on the Nexus 5. We will see more detail of this on a later test as well.
We also chart THD+N vs. Frequency. Here is the chart for the Note 3.
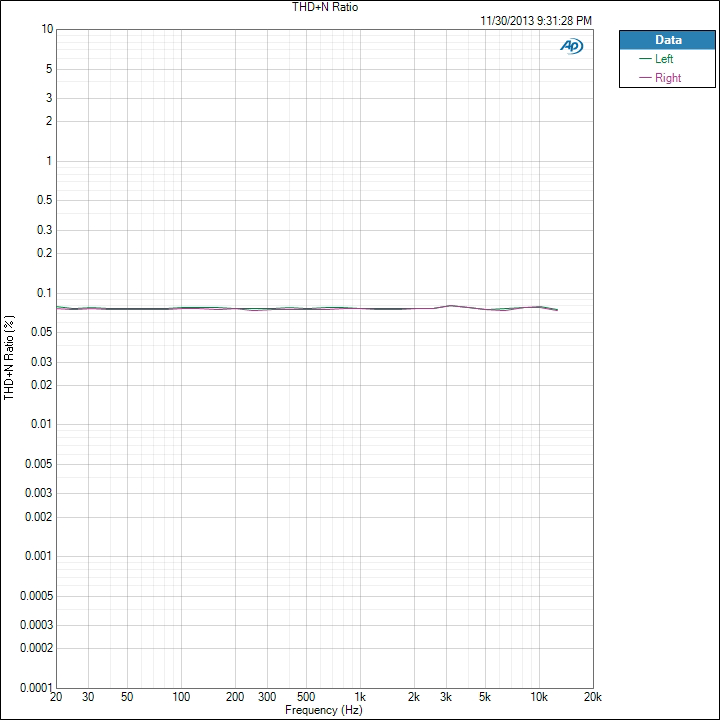
We see that THD+N is basically right below 0.08% for the whole spectrum. It moves up and down slightly, but is very constant. Now here is that Nexus 5 data.
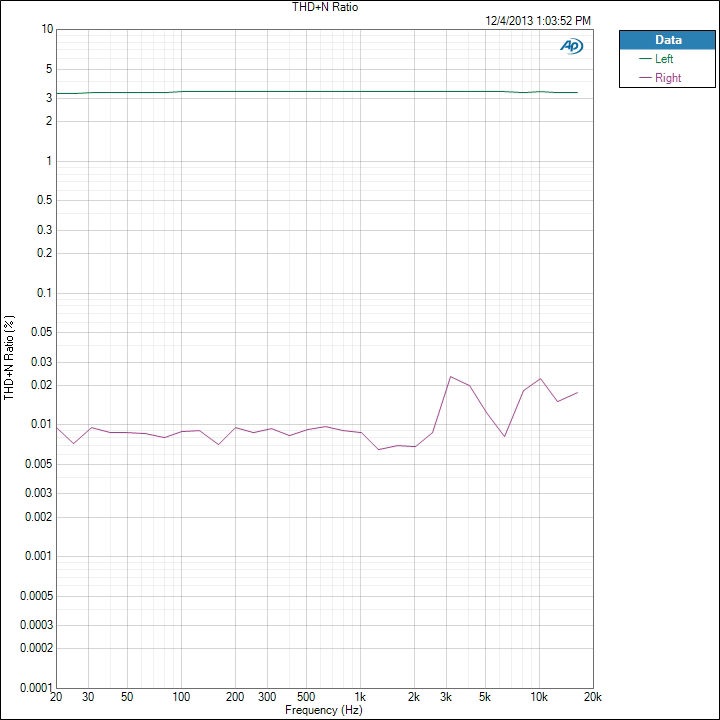
We see that the right channel is around 0.01% THD+N while the left channel, the clipped one, is over 3%. If we ran the Nexus 5 at a lower volume level we would see totally different results, as you’ll find out later, but this is how devices are typically measured.


188 Comments
View All Comments
porphyr - Monday, December 9, 2013 - link
This article is fantastic. I love that you are going to be testing audio quality. Obviously testing anything takes a lot of time, but I think it would be nice to see how these phones perform at "reasonable" listening levels. It would be great if you could pick dB level that is pleasant through the apple earpods and test a 2nd time at that, sort of how you use 200 nits for panel tests. That would give a more helpful representation of performance. Another thing that I would really appreciate is an explanation of how bad (or good) performance needs to be for most people to hear the difference (with bad and with good headphones). Thanks for the piece.99sport - Monday, December 9, 2013 - link
Thanks for the great article.Can you add built in speaker testing? I have an HTC one, and while I prefer to turn beats audio off when I use my phone in the car (listening to music on the car's speakers), I much prefer the sound of the built in speakers with beats audio on. As others have pointed out, all of the pieces in the chain are important to sound quality. My guess is that the frequency response of the built in speakers is much less at low frequency, and the beats audio increase in gain shown in your chart (below 100Hz) is designed to compensate for the frequency response characteristics of the built in speakers. In other words, if you tested the frequency response of the built in speakers (using a microphone with a known linear frequency response to gather the data), would the curve be much flatter when using the built in speakers with beats audio turned on versus turned off? Would the HTC one with beats audio on in fact have a much better (flatter) frequency response through the built in speakers than other phones do through their built in speakers?
It would be very useful to be able to compare the sound quality of the whole sound reproduction chain including the built in speakers – for me, the built in speaker sound quality and volume level is a major discriminator between phones – right up there with display color accuracy and camera quality.
dishayu - Monday, December 9, 2013 - link
Excellent initiative. The HTC One frequency response looks dreadful. I'm looking forward to graphs with beats enhancement off.As the next step, I would really like to see where different types of audio devices compare to each other... smartphones, ordinary media players (ipods), audiophile media players (HM-801), entry level/top level PC sound cards, realtek onboard chipsets.
NeoteriX - Monday, December 9, 2013 - link
I'm not sure if it's necessary to go through the effort of including PC soundcards, motherboard solutions, etc., but including media/MP3 players would definitely be a nice addition. The place that mobile phones have now as media consumption devices in addition to being phones came as an evolution from the original media device.However, the media device, given its singular purpose, prominently had sound quality as a major review component, and consumers did look at the DACs and opamps used. When they evolved to all-purpose smartphones, suddenly there were a lot of other features that took precedence, including processing power, display quality, etc.
Now that AnandTech is shepherding in a new look at audio quality, comparing the state of mobile phones to the heyday of media device would definitely be useful.
stunta - Monday, December 9, 2013 - link
Excellent article! It would be fantastic to see results from commonly used mp3 players. iPod, Sandisk Sansa (Clip, Fuze etc.) etc.How do you feed the test tone into the phone? Does the Audio Precision device come with test files you simply drop on the phone and play?
Also, do we know if these phones use the same amplifier for the built-in speakers and headphone outputs?
Thanks again!
Impulses - Monday, December 9, 2013 - link
I'll second this and dishayu above, it'd be a great reference.Hell, if we could get you to test output of a few BT receivers out there that might also be interesting and valuable to readers... I know BT's another can of worms as it introduces more compression etc, but it's actually gotten quite decent and those receivers end up replicating (and thus bypassing) many of the same components in phones.
There's not a lot of in depth reviews out there for those things but seeing as you can use them with any pair of headphones they'd fit right into your testing and they can be a suitable solution/alternative to a phone's line out. Something like the older Sony MW-300, or the newer models, or three equivalent Samsung/LG models.
Panzerknacker - Monday, December 9, 2013 - link
Please test the Oppo Find 5! I use that phone and it should have good audio capability. Wonder how it does vs iPhone 5.juhatus - Monday, December 9, 2013 - link
Now if only apple would enable their audio tech (noise-cancel atleast) on bluetooth.I downgraded from nokia 800 to iphone5 and atleast using the in-car-bluetooth the audio on calls went really bad.
On other comment, the graphs are huge in this article, maybe little scaling or something? some bare flatlines there and very big size graphs.
Nice article :)
Impulses - Monday, December 9, 2013 - link
Great article, though I have a quibble with the headphones to be used for future testing... Nothing against either as I've owned both, and the SR80 are a fine candidate (common entry level open headphone recommendation). The AKG have a reputation for being hard to drive and they aren't exactly very portable anyway, plus they represent another dynamic open headphone. I think a popular IEM (Ety, Shure, even Apple's dual driver IEM) might be a better second alternative, if it's at all possible with your rig... I know IEM are a pain to test due to seal issues and whatnot. Failing that maybe some other dynamic headphone that's more likely to be used with a mobile device (V-moda M-80? Senn HD25-1 II?), or something cheap yet extremely popular and good for the $ (Koss Portapro or KSC75).Impulses - Monday, December 9, 2013 - link
Also, if you could test and report output impedance for the phones that would be a HUGE help for people trying to figure out what kinda headphone would work best... Relatively high output Z isn't uncommon and it can wreck havoc with some lower impedance headphones, particularly sensitive IEM (and specially the multi balanced armature models that are so prevalent now).