A Lighter Touch: Exploring CPU Power Scaling On Core i9-13900K and Ryzen 9 7950X
by Gavin Bonshor on January 6, 2023 8:00 AM EST- Posted in
- CPUs
- AMD
- Intel
- 65W
- TDP
- Ryzen 9 7950X
- Core i9-13900K
- Power Scaling
- Efficiency
- 105W
- 125W
- 253W
- 230W
- PPT
Core i9-13900K & Ryzen 9 7950X Scaling Performance: CPU Short Form
For the compute side of our testing to determine how well the Core i9-13900K and Ryzen 9 7950X scale at different power levels, we've opted for a range of CPU-intensive benchmarks, particularly from the rendering and encoding section of our test suite.
To keep the playing field even, we are using the same SK Hynix DDR5-5600B 2 x 16 GB memory kit throughout all of our testing. We've separated the results within the same graph to outlay performance differences at different power levels so that users can see the differences and comparison in performance on offer from both the Core i9-13900K and Ryzen 9 7950X processors.
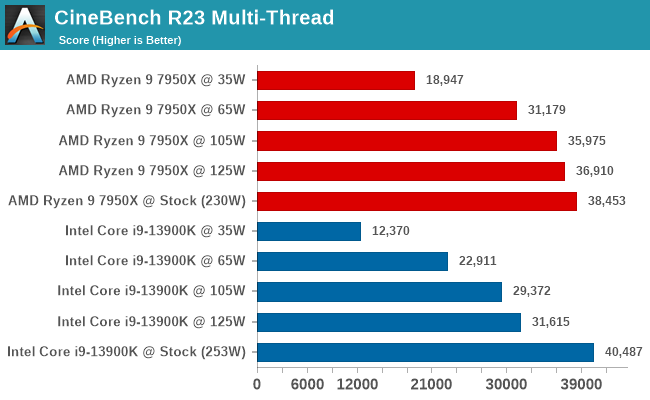
CineBench R23: Single and Multi-Threaded Performance
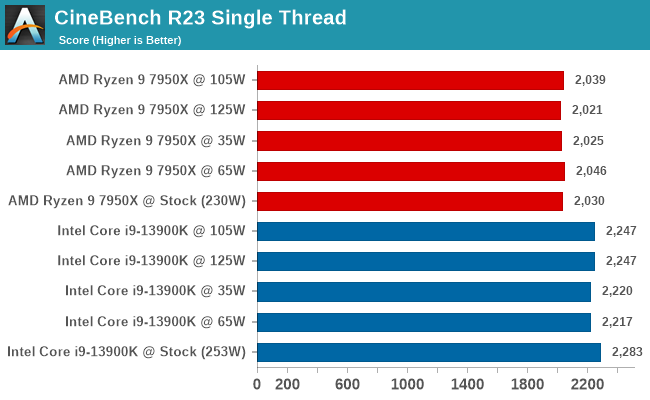
Focusing on performance in CineBench, it is worth highlighting that in the single-threaded test, Intel's Core i9-13900K displayed better single-core performance throughout. It didn't impact single-threaded performance on either processor despite restricting the power levels, which is exactly what we'd expect to find. While highly clocked CPU cores are very expensive from a power perspective, they are not so expensive as to consume the complete power budget of chips such as these.
Looking at multi-threaded performance in CineBench R23, this is where restricting the power levels makes the difference. Although Intel has the best performance in CineBench R23 MT at stock settings, it's AMD that scales better (i.e. loses less performance) as the power is restricted. Even at 65 W, the Ryzen 9 7950X is faster than the Core i9-13900 at 125 W, which is very impressive. Both processors take a massive hit in performance at 35 W, which is to be expected as we're now some 200 Watts below their stock power limits.
C-Ray 1.2: 4K, 16 Rays Per Pixel
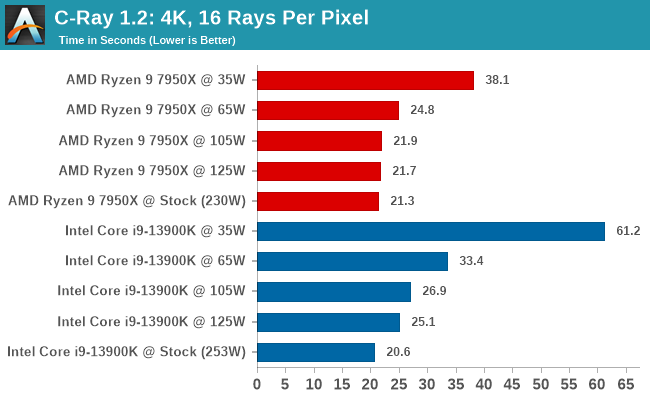
Looking at the results in our C-Ray benchmark, the results between stock settings to 65 W impacted our figures. Starting with the Ryzen 9 7950X, there was a marginal performance loss between stock settings at 125 W and 105 W. Going from stock settings to 65 W (2.5X power), there was a drop in C-Ray performance of around 16%.
Focusing on the Core i9-13900K, its performance was heavily power reliant when comparing stock settings to 125 W, 105 W, and 65 W. Even from stock settings to 125 W, there's a performance loss of around 21%, and even more so comparing stock settings to 65 W, which equates to around 38%.
Things tailed off massively when both set to 35 W, with the AMD Ryzen 9 7950X beating the Intel Core i9-13900K convincingly here.
POV-Ray 3.7.1:
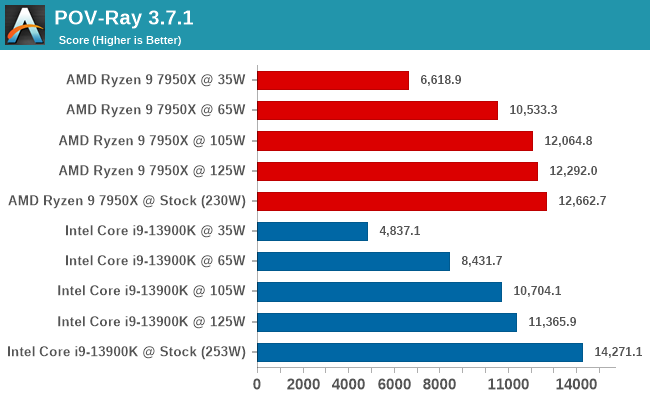
In our POV-Ray benchmark, we saw some interesting behavior. Although the Core i9-13900K at default settings comfortably beat the Ryzen 9 7950X, the 7950X held its performance well when dropping down the power, with the 7950X's result at 65 W being similar to the 13900K at 105 W. This shows that the Ryzen 9 7950X and its 5 nm die is more scalable at lower power.
Blender 3.4: CPU Only Compute
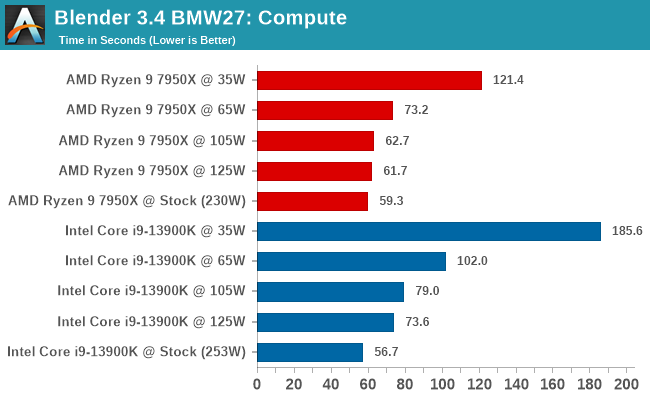
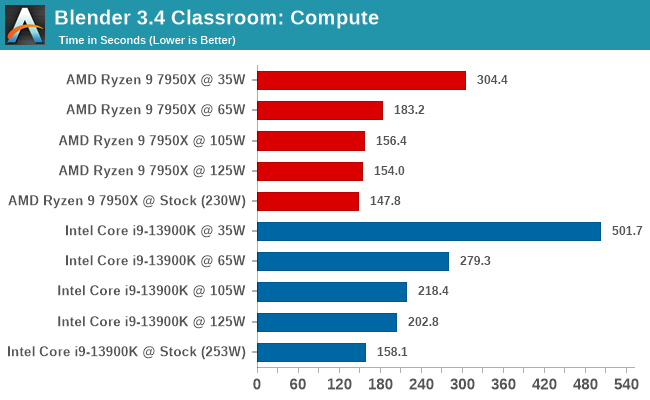
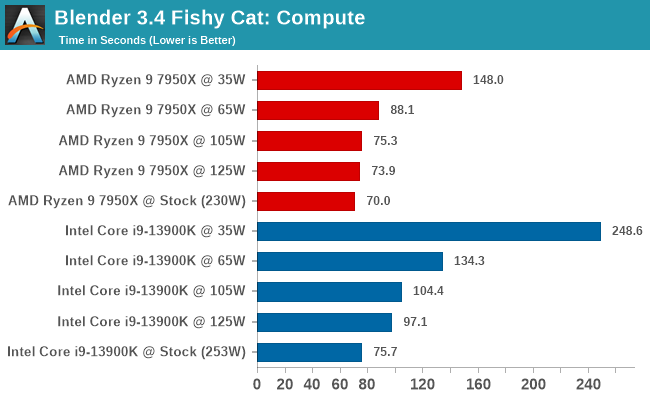
At default settings, the Core i9-13900K and Ryzen 9 7950X was competitive in all of the Blender sub-tests, even when restricting the power. Once power was restricted, we saw that the 7950X held onto much of its performance, while the 13900K didn't fare so well. In the Fishy Cat subtest at 65 W, the 7950X was 62% faster than the 13900K, which is impressive scaling here by AMD.
x264 Encoding: 1080p and 4K Bosphorus
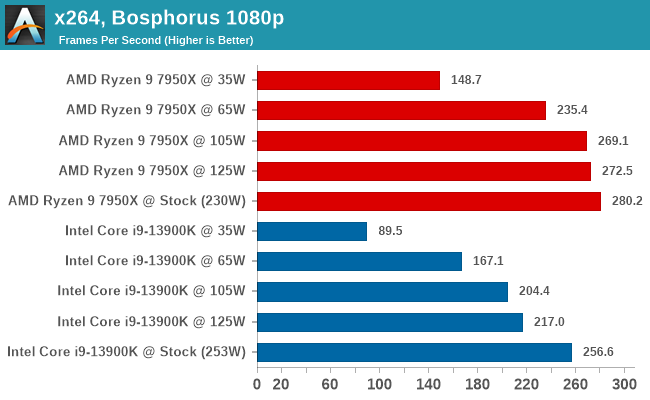
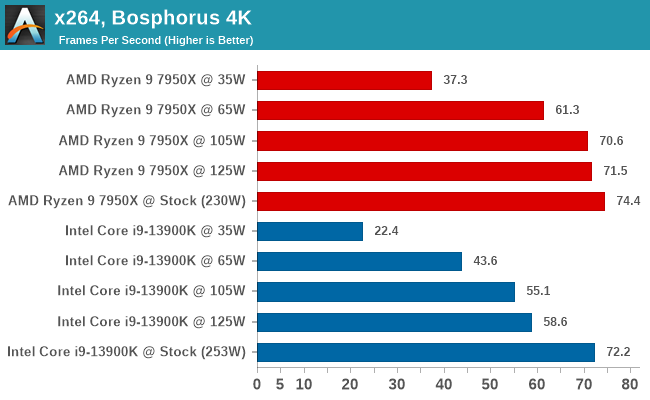
The x264 benchmark focuses on encoding performance, and at default settings, AMD's Ryzen 9 7950X wins out. Even dropping down to 125 W, the 7950X only loses around 2% at 1080p and around 4% at 105 W. At 65 W, the 7950X is around 16% slower than at default settings.
Looking at Intel's Core i9-13900K, the 13900K loses around 15% performance by restricting power to 125 W compared to default settings. This is another example that the 5 nm Zen 4 architecture scales much better at lower power envelopes than Intel's 10 nm refresh; this isn't unexpected, however.


61 Comments
View All Comments
Salipander - Tuesday, March 28, 2023 - link
Very interesting and essential stuff. Now I wonder how the 13700K would fare against the 13900K with these varying power limits. Which one is faster at a given power limit? Imagine that they both perform the same... then there is no reason to buy the 13900K at all, unless you go for unlimited power usage.