ASRock Industrial NUC BOX-1360P/D5 Review: Raptor Lake-P on the Leading Edge
by Ganesh T S on July 18, 2023 10:30 AM EST- Posted in
- Systems
- Intel
- UCFF
- Mini-PC
- ASRock Industrial
- Raptor Lake-P
System Performance: Multi-Tasking
One of the key drivers of advancements in computing systems is multi-tasking. On mobile devices, this is quite lightweight - cases such as background email checks while the user is playing a mobile game are quite common. Towards optimizing user experience in those types of scenarios, mobile SoC manufacturers started integrating heterogenous CPU cores - some with high performance for demanding workloads, while others were frugal in terms of both power consumption / die area and performance. This trend is now slowly making its way into the desktop PC space.
Multi-tasking in typical PC usage is much more demanding compared to phones and tablets. Desktop OSes allow users to launch and utilize a large number of demanding programs simultaneously. Responsiveness is dictated largely by the OS scheduler allowing different tasks to move to the background. Intel's Alder Lake processors work closely with the Windows 11 thread scheduler to optimize performance in these cases. Keeping these aspects in mind, the evaluation of multi-tasking performance is an interesting subject to tackle.
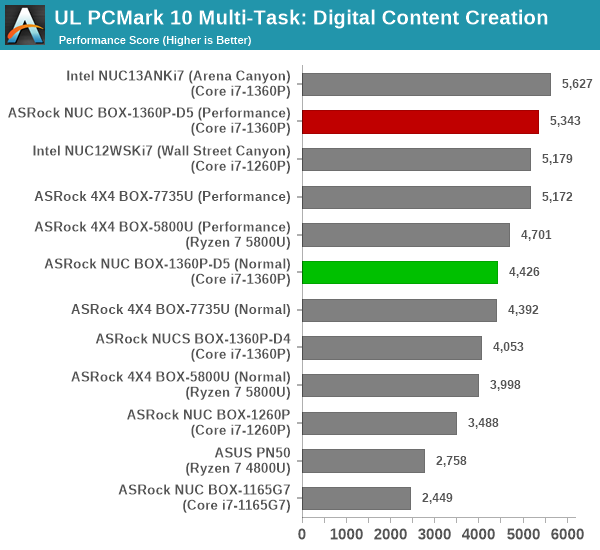
We have augmented our systems benchmarking suite to quantitatively analyze the multi-tasking performance of various platforms. The evaluation involves triggering a ffmpeg transcoding task to transform 1716 3840x1714 frames encoded as a 24fps AVC video (Blender Project's 'Tears of Steel' 4K version) into a 1080p HEVC version in a loop. The transcoding rate is monitored continuously. One complete transcoding pass is allowed to complete before starting the first multi-tasking workload - the PCMark 10 Extended bench suite. A comparative view of the PCMark 10 scores for various scenarios is presented in the graphs below. Also available for concurrent viewing are scores in the normal case where the benchmark was processed without any concurrent load, and a graph presenting the loss in performance.
| UL PCMark 10 Load Testing - Digital Content Creation Scores | |||
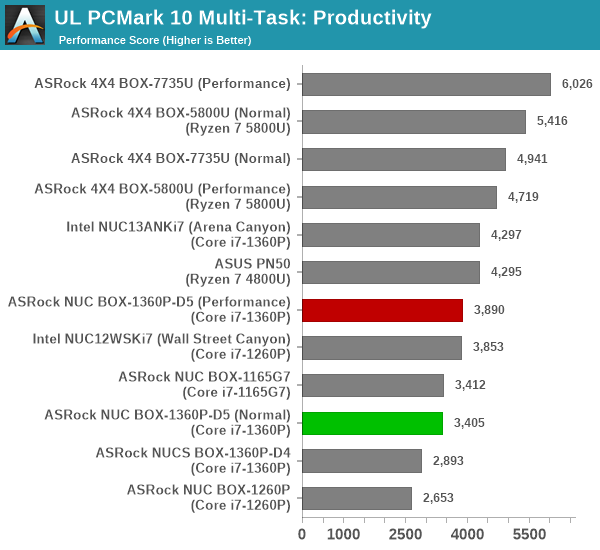
| UL PCMark 10 Load Testing - Productivity Scores | |||
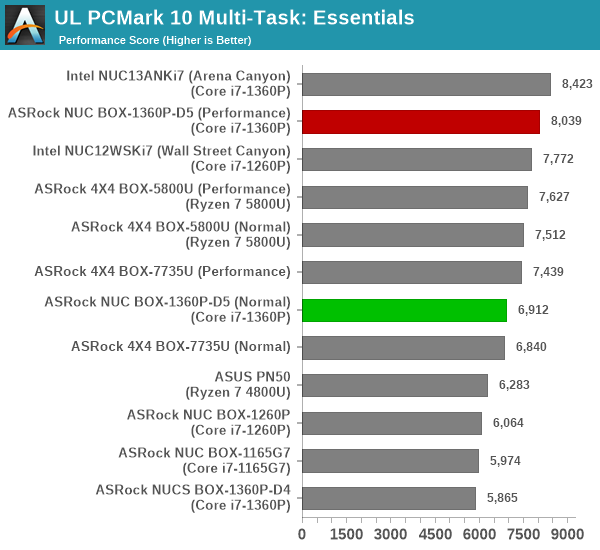
| UL PCMark 10 Load Testing - Essentials Scores | |||
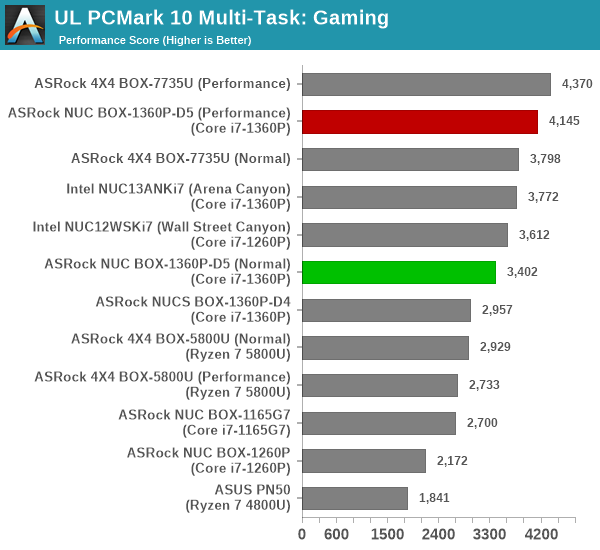
| UL PCMark 10 Load Testing - Gaming Scores | |||
| UL PCMark 10 Load Testing - Overall Scores | |||
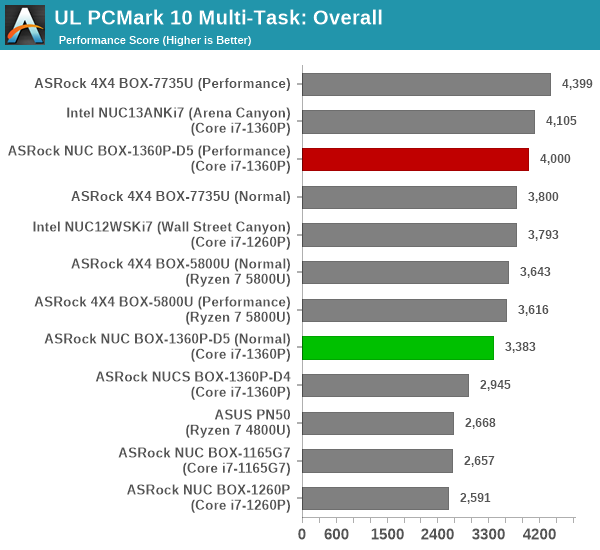
All PCMark 10 workload components see the relative ordering being maintained even after the addition of the concurrent loading.
Following the completion of the PCMark 10 benchmark, a short delay is introduced prior to the processing of Principled Technologies WebXPRT4 on MS Edge. Similar to the PCMark 10 results presentation, the graph below show the scores recorded with the transcoding load active. Available for comparison are the dedicated CPU power scores and a measure of the performance loss.
| Principled Technologies WebXPRT4 Load Testing Scores (MS Edge) | |||
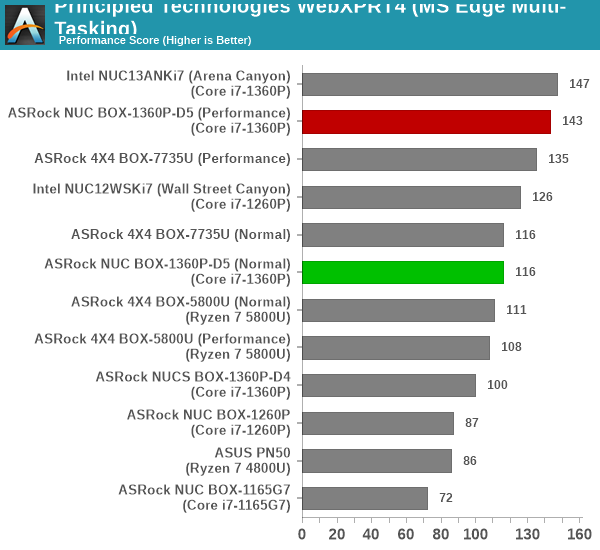
Despite a 50%+ loss in performance the 40W PL1 configuration of the NUC BOX-1360P/D5 and the Arena Canyon NUC take the top spots even when concurrent loading is active.
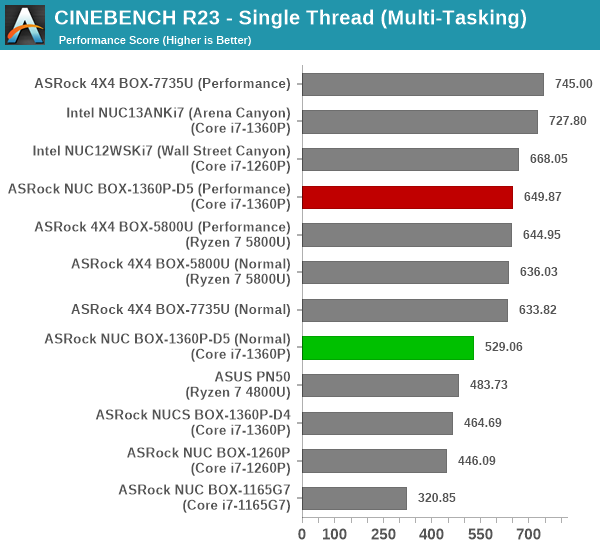
The final workload tested as part of the multitasking evaluation routine is CINEBENCH R23.
| 3D Rendering - CINEBENCH R23 Load Testing - Single Thread Score | |||
| 3D Rendering - CINEBENCH R23 Load Testing - Multiple Thread Score | |||
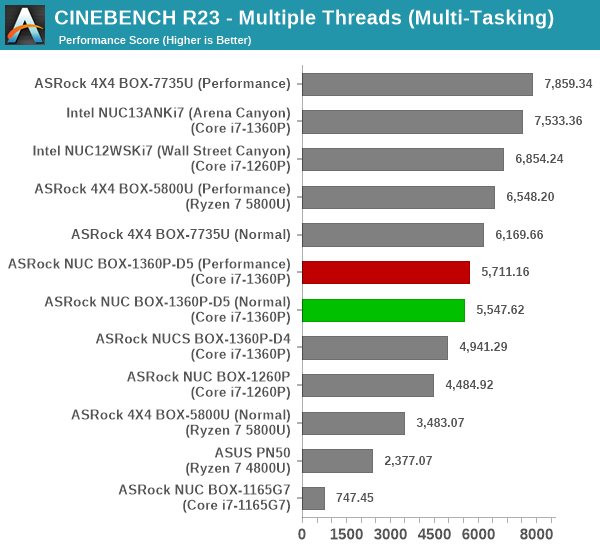
The presence of heterogeneous cores is a challenge for handling new multi-threaded workloads when a multi-threaded workload like a transcoding task is already active. That is the primary reason for the AMD-based systems showing minimal performance loss when concurrent loads of different complexities are simultaneously triggered.
After the completion of all the workloads, we let the transcoding routine run to completion. The monitored transcoding rate throughout the above evaluation routine (in terms of frames per second) is graphed below.
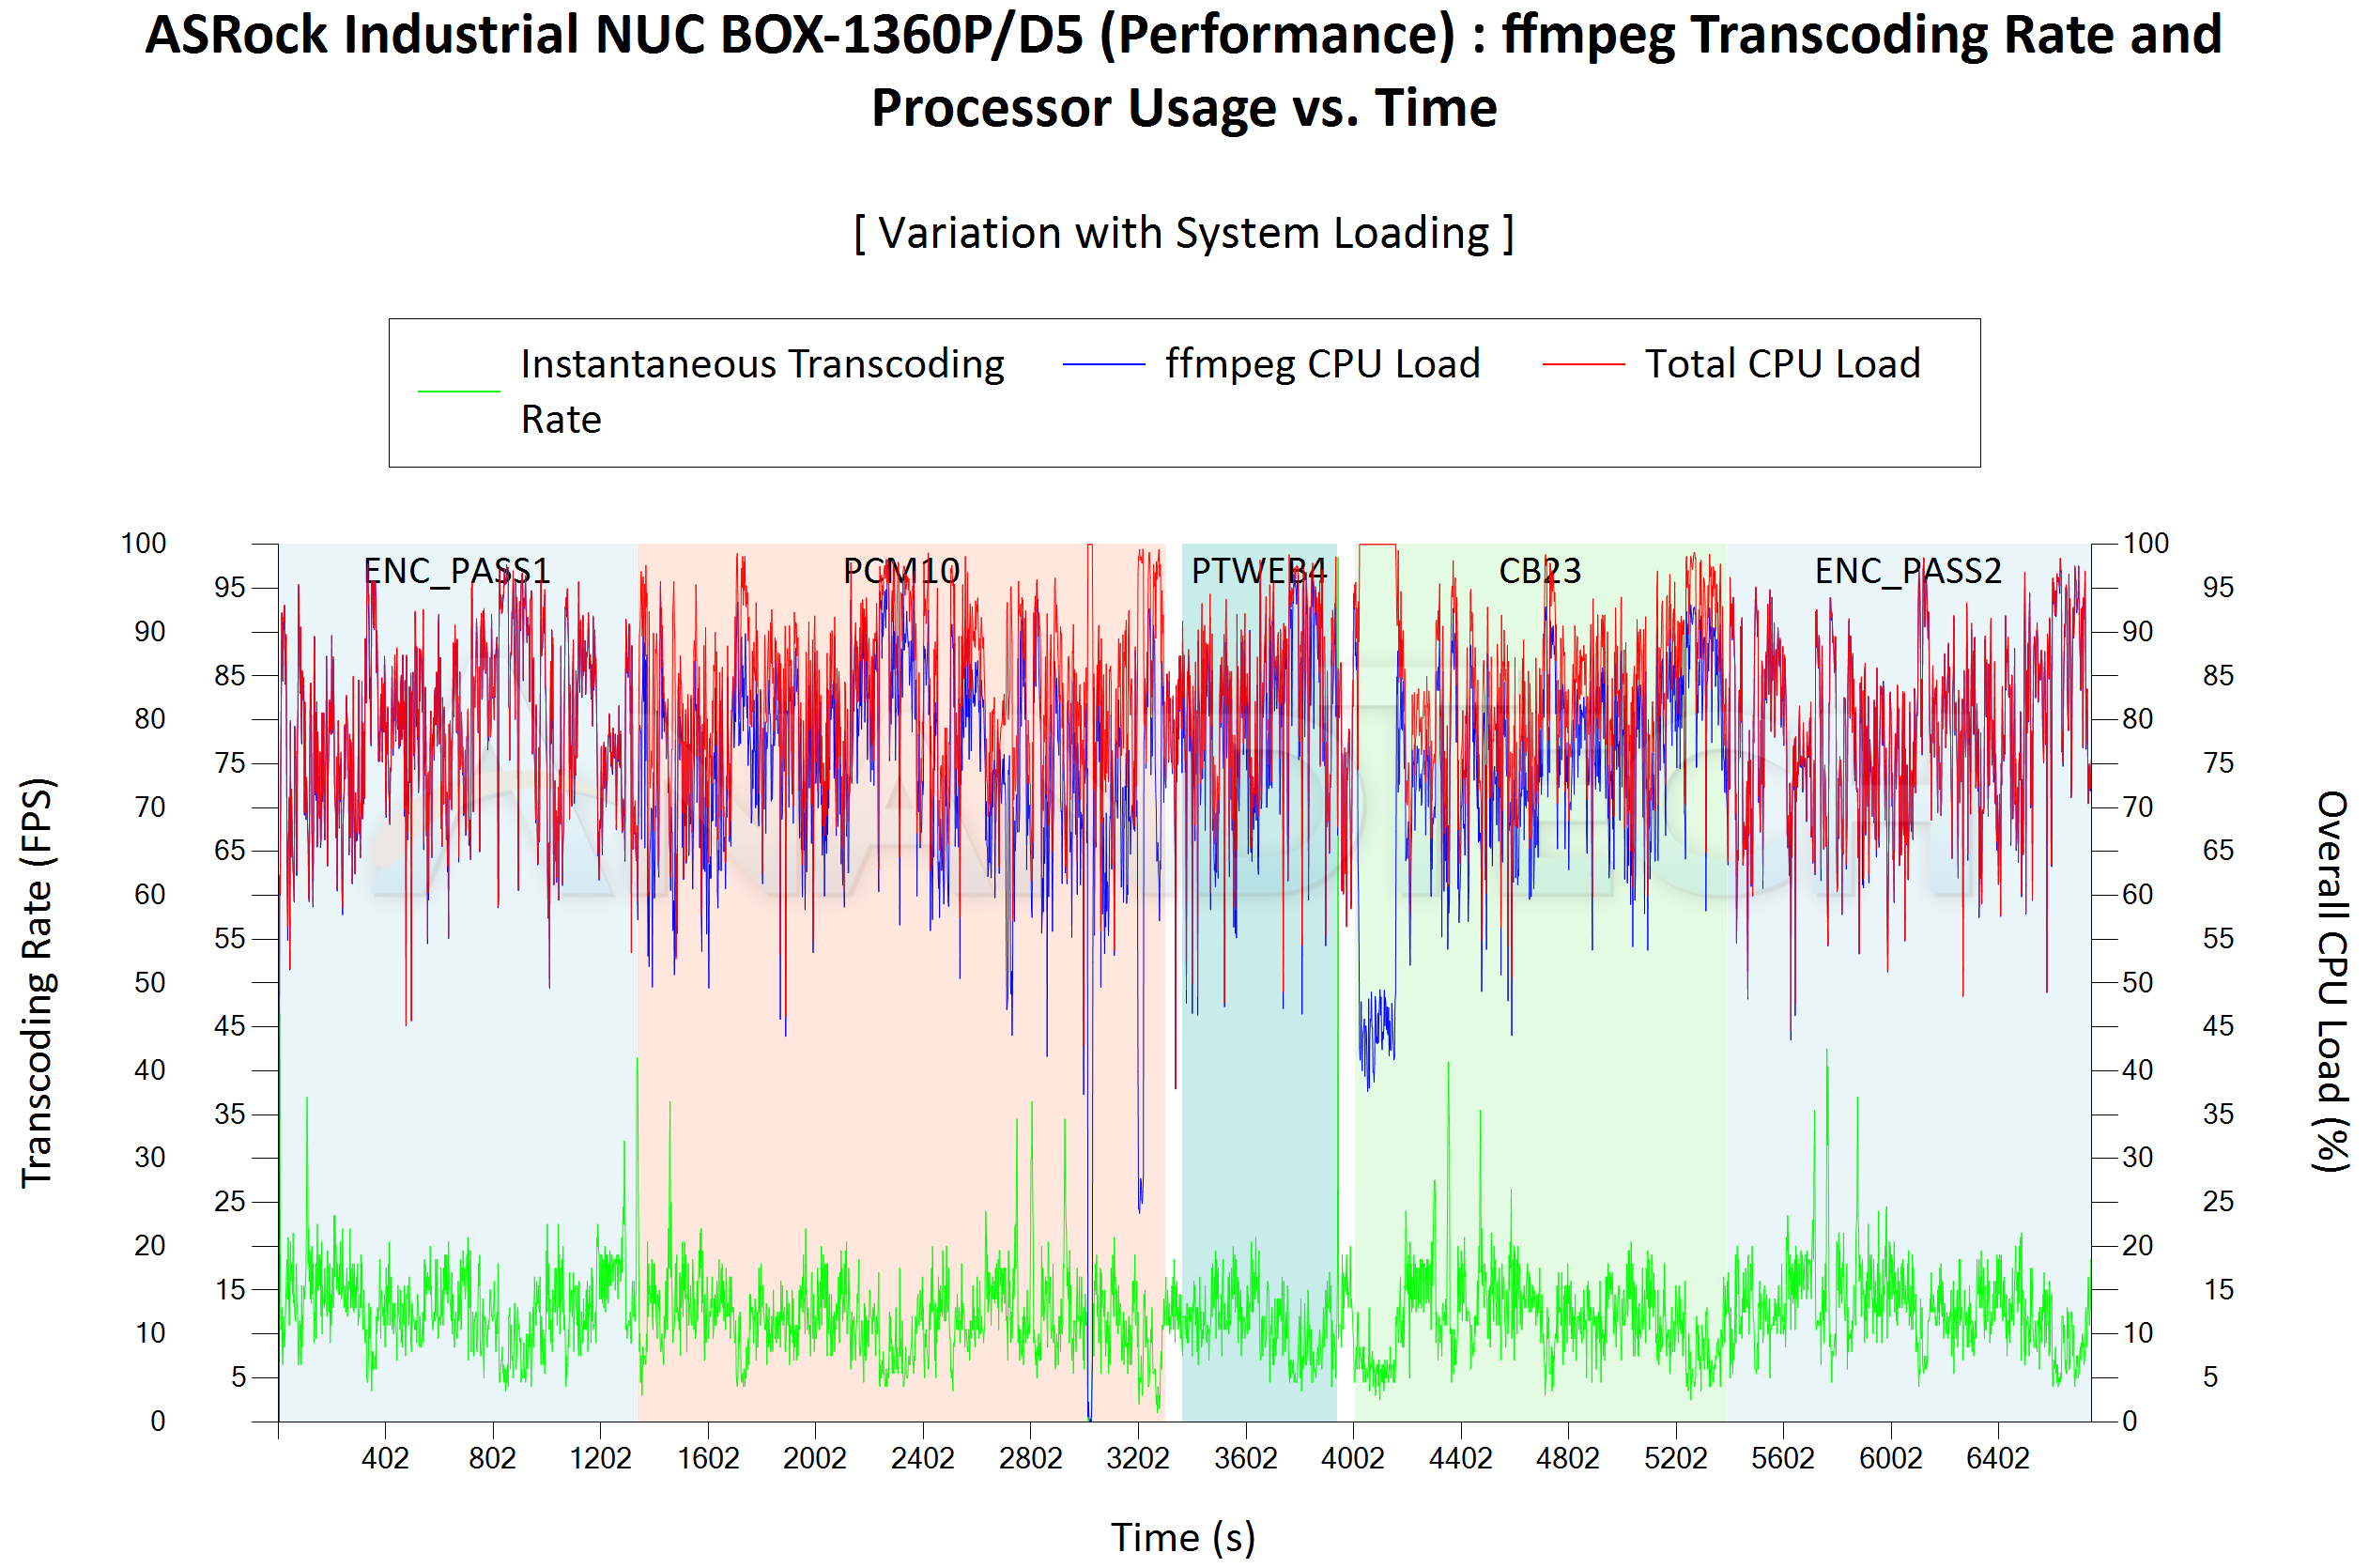
The behavior of the NUC BOX-1360P/D5 is very similar to that of the NUCS BOX-1360P/D4, and it is not immediately obvious if Thread Director is working as intended.
| ASRock Industrial NUC BOX-1360P/D5 (Performance) ffmpeg Transcoding Rate (Multi-Tasking Test) | |||
| Task Segment | Transcoding Rate (FPS) | ||
| Minimum | Average | Maximum | |
| Transcode Start Pass | 3.5 | 13.21 | 46.5 |
| PCMark 10 | 0 | 11.69 | 39.5 |
| WebXPRT 4 | 3.5 | 11.18 | 21 |
| Cinebench R23 | 2.5 | 11.74 | 41 |
| Transcode End Pass | 4 | 13.01 | 42.5 |
The silver lining seems to be that the drop in transcoding performance is not as heavy as what was seen in other systems.


21 Comments
View All Comments
Grapple - Tuesday, July 18, 2023 - link
Would love to see an Intel T-series (35W) processor SFF/UCFF in the comparison mix, such as the Lenovo ThinkStation P3 Tiny or its predecessor, the P360 Tiny.meacupla - Tuesday, July 18, 2023 - link
It seems like it is only worth it, if it cost less than a 7735U or 7740Unandnandnand - Wednesday, July 19, 2023 - link
You mean 7840U. There is no 7740U.meacupla - Wednesday, July 19, 2023 - link
yeah, that one. I hate AMD's naming scheme. It's so confusing.fallaha56 - Wednesday, July 19, 2023 - link
Yes but the Zen4 7840U will destroy the Intel chipOdd not to see one of the many models of equivalent AMD NUC here…
sjkpublic@gmail.com - Thursday, July 20, 2023 - link
The Intel version is roughly $200-300 more than a 7735U which is roughly equal in performance.I got tired of all the Intel microcode patches and went AMD. On top of that Intel has the ME which is not really needed for the single user and is another security hole.
Samus - Tuesday, July 18, 2023 - link
It's good to see they took Thunderbolt into consideration here. That's a real oversight to this day on professional and enterprise products that annoys the crap out of me, ie, the Probook 450 G9 and 650 G9 are identical down to the case and internals except for one IC (Burnside) that adds TB4. PCIe 4.0 storage is nerfed in firmware on the 450 (limited to 3.0) but easily reactivated with a hex editor.The 650 model sells at a $300 MSRP markup over the nerfed 450. It's ridiculous.
That said, if this thing has full TB4, it's strange they are using so much real estate for display ports when they could put 2x TB4 Type-C ports in their place offering substantially more capability. Throw in a $5 dongle for DP.
meacupla - Tuesday, July 18, 2023 - link
USB-C to Displayport adapters are usually $15~20Samus - Wednesday, July 19, 2023 - link
$8 on Amazon, $10 for Lenovo branded one, and those are retail price. An OEM buying thousands in bulk will get them for a few bucks a pop. Not to mention the ports are cheaper and simpler to implement on a PCB over the higher pin count (and license requirements) or HDMI. The whole thing stinks like yesterdays diapers.fallaha56 - Wednesday, July 19, 2023 - link
Come on guysAny Zen4 7840U NUC will destroy the ‘cutting edge’ Intel chip here
Let’s see one of the many models of equivalent AMD NUC reviewed…