Smartphone Audio Quality Testing
by Chris Heinonen on December 8, 2013 5:15 PM EST- Posted in
- Smartphones
- Audio
- Mobile
- Tablets
- Testing
THD+N is a measure of the total harmonic distortion and noise compared to the signal. The lower the number, the less distortion and noise there is relative to the fundamental frequency. THD+N is measured by driving a 1 kHz sine wave at maximum volume. Because there is always some inherent background noise, the THD+N is almost always lowest at maximum output so that is used for the measurement.
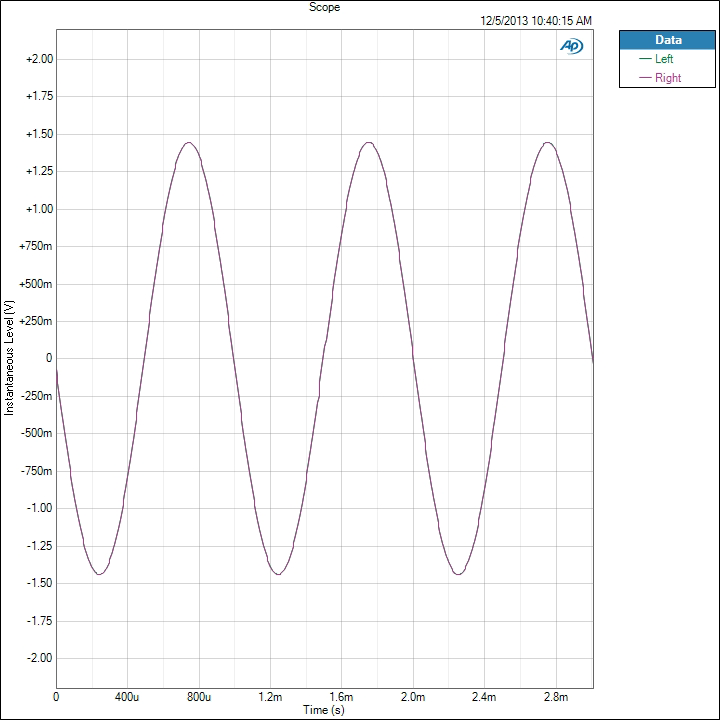
There are two results that we take from this: a sine wave and a FFT spectrum. On the sine wave both channels should line up perfectly, and it should be as close to an accurate sine wave as possible. On the FFT we want to see a peak at 1 kHz and everything else as low as possible. The most common artifact you will see are harmonic sidebands at multiples of 1 kHz.
For an example of data that looks good, here is the sine wave of the iPhone 5. We see a sine wave that is good, with channels that overlap perfectly and no deviation. This is what we expect to see.
Now for a different example we look at the Nexus 5. Run at maximum volume we see that the left channel is clipping in the sine wave. Likely the power to the headphone amplifier is not enough to drive both channels and so this is the result. UPDATE: Tested this with 4.4.1 and no change.
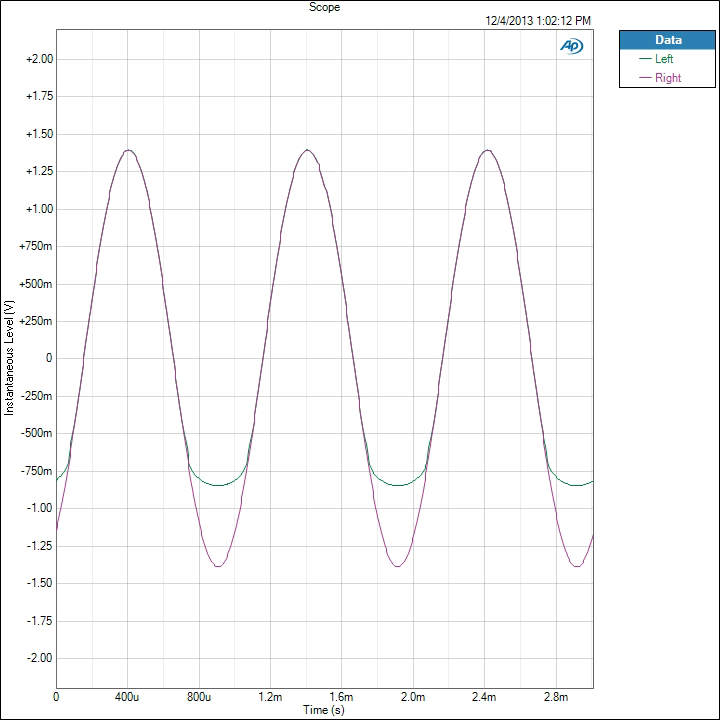
The iPhone 5 produces a THD+N ratio of 0.003134% while because of the clipping, the Nexus 5 is producing 13.789197%. Any level over 1% is considered to be past the clipping point of an amplifier and it seems that the Nexus 5 cannot be driven at maximum volume. I tested two samples to verify, and on both the performance is identical.
Now if we look at the FFT for this test, we see how this distortion is showing up. First, the iPhone 5 is very quiet.
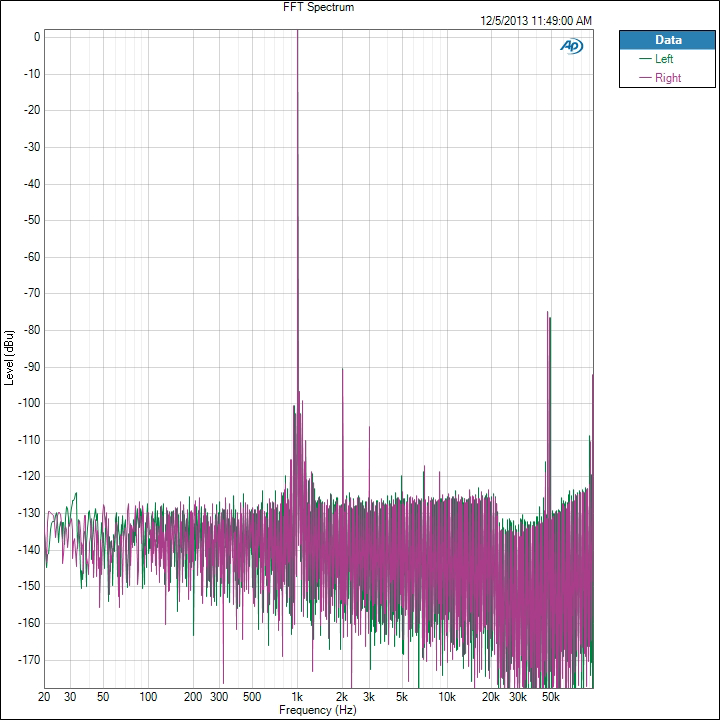
There is a 2 kHz peak that is -93 dB below the fundamental frequency, and the 3rd harmonic at 3 kHz is over -109 dB below it. All the harmonics past that are at -120 dB below the fundamental tone. There is some noise out at 50 kHz but this is so far past the level of human hearing that it is safely ignored. Now the Nexus 5 FFT.
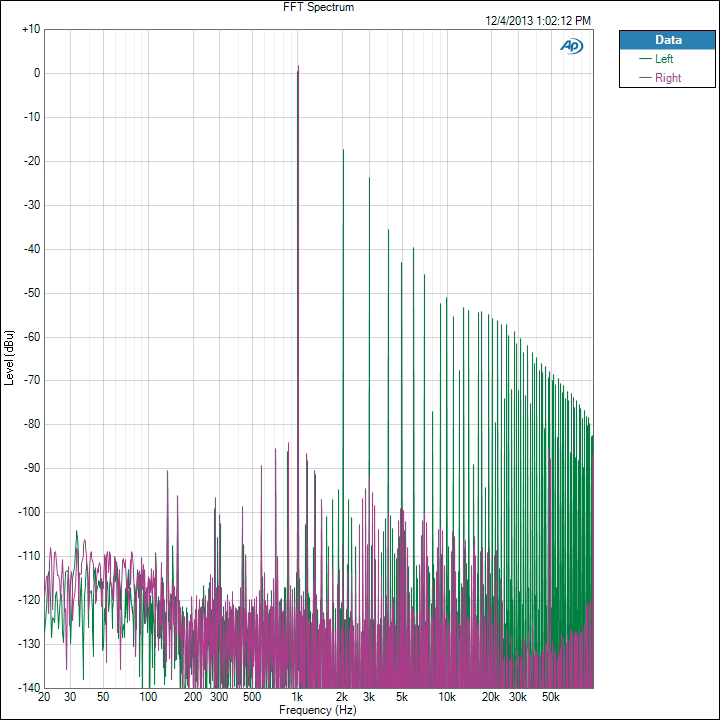
We see the right channel, which didn’t clip, looks good. The 2nd harmonic is -111 dB and the 3rd harmonic is -93 dB. On the left channel the 2nd harmonic is only -18 dB and the 3rd harmonic is -24 dB. Even at the 9th harmonic we are still only -52 dB below the fundamental tone. This is causing these incredibly high THD+N numbers that we are seeing on the Nexus 5. We will see more detail of this on a later test as well.
We also chart THD+N vs. Frequency. Here is the chart for the Note 3.
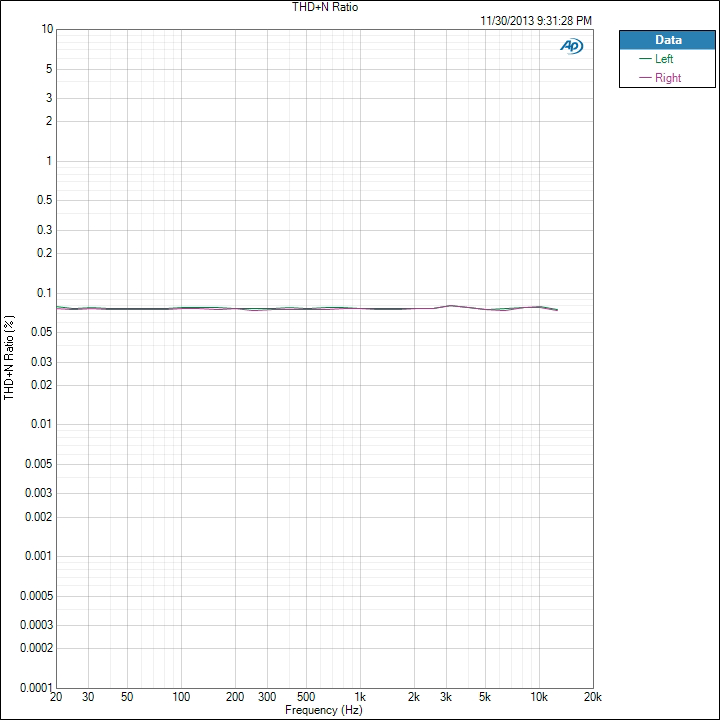
We see that THD+N is basically right below 0.08% for the whole spectrum. It moves up and down slightly, but is very constant. Now here is that Nexus 5 data.
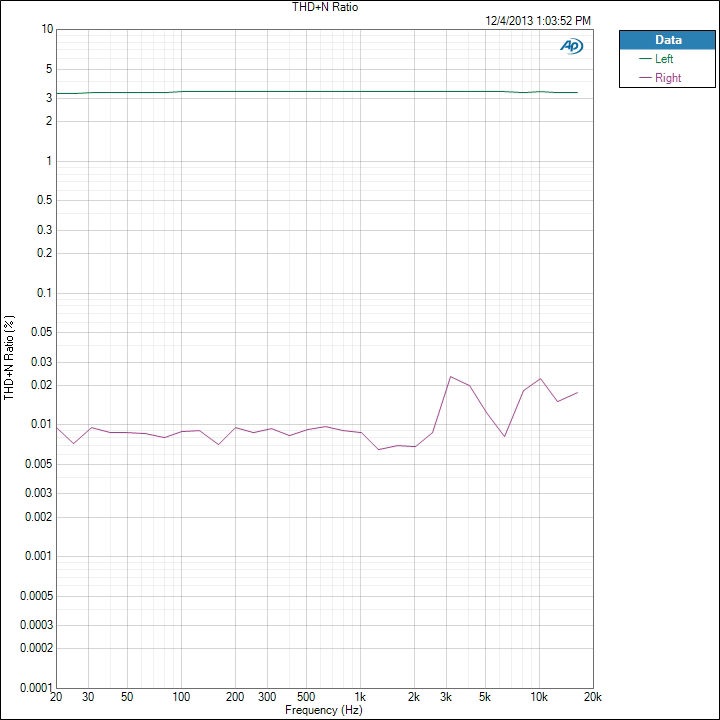
We see that the right channel is around 0.01% THD+N while the left channel, the clipped one, is over 3%. If we ran the Nexus 5 at a lower volume level we would see totally different results, as you’ll find out later, but this is how devices are typically measured.


188 Comments
View All Comments
brusselwilson - Sunday, December 8, 2013 - link
Is sample variation an issue of relevance for smartphone audio systems?cheinonen - Sunday, December 8, 2013 - link
No more than it would be with anything else I would think. For the Nexus 5 I tested two different samples (one from Brian, one from a friend of mine) and both exhibited this issue. So you might see small variations, as you would with any display or anything else, but nothing major I wouldn't think.vailr - Sunday, December 8, 2013 - link
Another factor to consider: certain cell companies can enable enhanced audio quality for cell phone calls, but only on selected cell phone models. The IPhone 5 has that ability, as I recall. Not sure about the specifics, but I believe that both ends of the cell call must be using supported phones, as well as: the cell provider must enable that feature. That would enable cell calls to have better voice quality than land line calls, via increased audio frequency response.shenkey - Sunday, December 8, 2013 - link
Could we also get Windows Phone devices included in the test. Lumia 920 and 1520 should fit in the range.cheinonen - Sunday, December 8, 2013 - link
I'll add whatever I can when I get a chance. This first run has taken almost all my time up since the week of Thanksgiving.hopfenspergerj - Sunday, December 8, 2013 - link
It's not useful to measure noise/dynamic range at the highest volume setting. You have to measure at one of the lowest settings to determine whether the phone truncates bits, whether the noise floor does not decrease with the volume setting, etc.I have an htc dna and it is completely, totally, utterly useless for playing music with sensitive IEMs; I suspect many android phones with "-90db" thd+n measurements are similarly bad in practice.
hopfenspergerj - Sunday, December 8, 2013 - link
Not to mention poor shielding on the dna causes the phone to output chirping and static and other loud extraneous noises whenever it transmits data.cheinonen - Sunday, December 8, 2013 - link
We have stepped output level charts as well that measure this, they just aren't included here right now. I can start to pull those out for current and future tests if we want to use them.evonitzer - Monday, December 9, 2013 - link
I saw that one graph included when you compared the Nexus 5 and G2 at different levels and I think it should be in all the reviews. I always run my IEM's in the lower half of the volume range so I am quite interested in how they perform. As others have said, excellent work!DoctorG - Tuesday, December 10, 2013 - link
Same here -- I always run my good IEM's below half volume at least (usually more like a third.) No point in having good headphones & music if the volume is turned up so loud it hurts....BTW Great job Chris! I have always wanted more in-depth reviews about smartphone audio quality. It's very important to me, but so far there haven't been any reliable/objective tests available. Thanks! Just a thought, but maybe it would be possible to test against a pro-quality amp/DAC? When I use my GNex, the quality is obviously very different from my audio interface that I use with ProTools. It'd be interesting to see just how much of that is measurable...