Smartphone Audio Quality Testing
by Chris Heinonen on December 8, 2013 5:15 PM EST- Posted in
- Smartphones
- Audio
- Mobile
- Tablets
- Testing
We spend a lot of time watching and listening to our smartphones and tablets. The younger you are the more likely you are to turn to them for watching a movie or TV show instead of an actual TV. For a lot of us it is our primary source of music with our own content or streaming services. Very rarely when new phones or tablets are announced does a company place any emphasis on the quality of the audio.
Display quality also used to receive very little attention. As more and more people reported on the display performance, more companies started to take notice. Now benefits like “Full sRGB gamut” or “dE < 3” are touted on new products. So now we are going to introduce a new set of testing for smart phones and tablets, audio performance.
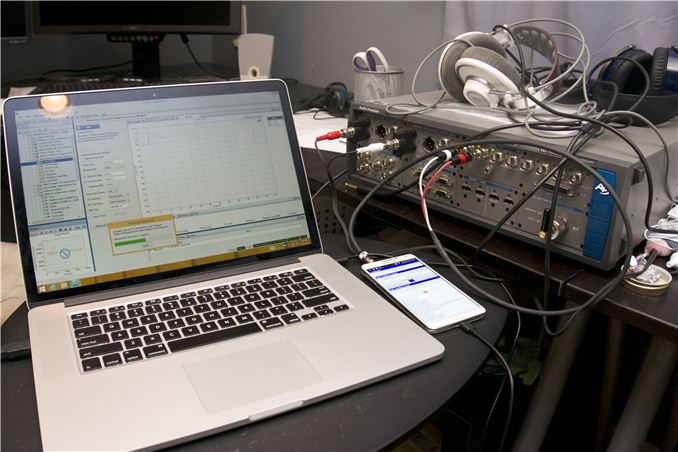
To do this right we went to the same company that all the manufacturers go to: Audio Precision. Based out of Beaverton, OR, Audio Precision has been producing the best audio test equipment out there for over 25 years now. From two channel analog roots they now also test multichannel analog, HDMI, Optical, Coaxial, and even Bluetooth. Their products offer resolution that no one else can, which is why you will find them in the test and production rooms of almost any company.
Just recently they introduced a brand new set of audio tests for Android devices. Combined with one of their audio analyzers, it allows us to provide performance measurements beyond what has been possible before. Using an Audio Precision APx582 analyzer we set out to analyze a selection of Android phones to see what performance difference we can find. More phones and tablets will follow as these tests can be run.
The Test Platform
The test platform is the Audio Precision APx series of audio analyzers. For this initial set of tests I used an APx 582 model, which has two analog outputs and 8 channels of analog inputs. The outputs are not necessary as all of the test tones are provided by Audio Precision for playback on the devices. For each set of tests we can add a load, simulated or real, to see how the device handles more demanding headphones. For this article I am sticking with only a set of the updated Apple Earbuds. They are probably the most common headphone out there and easy to acquire to duplicate testing. For future tests the other loads will be AKG K701 headphones and Grado SR60 headphones. Both models are popular, and I happen to own them.
There are a few main tests we are going to use for all these reviews. Those key tests are maximum output level, Total Harmonic Distortion + Noise (THD+N), Frequency Response, Dynamic Range (as defined by AES17), and Crosstalk. These tests are the exact same ones that manufacturers will be running to verify their products. Most of these tests will be run at maximum output levels. Most amplifiers perform best at close to their maximum levels, as the residual noise compared to the signal decreases, and so that is what they are typically tested at.
We might add more tests as we decide they are relevant to our testing. I will also attempt to go back and fill in as much data as possible from previously reviewed devices as time permits. Now to look at the tests and see our results for our initial set of phones.


188 Comments
View All Comments
Origin64 - Monday, December 9, 2013 - link
"Here we see that Beats is adding a +3.5 dB boost from 60 Hz to 90 Hz, but the deviation from 0 dB goes from 30Hz to 300 Hz. Past 6.5 kHz we also see a rise in the treble."And people pay 300 bucks for a headphone that does exactly, and only, this. Its a good joke, really.
willis936 - Monday, December 9, 2013 - link
To Chris:Check out NwAvGuy's blog if you haven't already. He appeared and disappeared a few years ago bringing with him a headphone amp design and (more importantly) a breath of fresh, objective air in testing audiophile headphone equipment. He has some good data there and comparing testing methodologies might be insightful for things to try here on anandtech.
cheinonen - Monday, December 9, 2013 - link
I've read his full blog and wish it was still updated.Impulses - Monday, December 9, 2013 - link
Tyll's Inner Fidelity blog is another great resource.adityanag - Monday, December 9, 2013 - link
This is excellent. Also the reason why I've been reading Anandtech since 1998. Keep up the great work, guys.Gadgety - Monday, December 9, 2013 - link
I appreciate this article, Chris. An improvement would be a summary table of all the models compared on one page, and some sort of analysis beyond the "poor performance" comparison. I've also seen data that the specs will change significantly for worse when headphones are attached to the phones.xodusgenesis - Monday, December 9, 2013 - link
Finally some in-depth audio anlysis. I've been waiting for this as I actually use my smartphone as a phone (I know shocker in today's age) and media player most of the time.ZoSo - Monday, December 9, 2013 - link
Would like to see some results of a few current WP8 phones, Nokia in particular.asgallant - Monday, December 9, 2013 - link
Awesome! I have been wanting to see some audio analysis done for a while now. Is there any chance of extending this to test audio on motherboards, sound cards, and laptops as well?lever_age - Monday, December 9, 2013 - link
Glad to see this. My suggestions are as follows:1. Include an output impedance measurement. If you're using these as decent-quality audio players with headphones, this is one of the most important things to know for certain headphones, at least. Who cares what the measured frequency response with a resistor is if your source's output impedance is causing +/- 5 dB swings in response for some balanced armature IEMs?
2. Standardize THD+N tests to a given output level for all phones (say 0.1 V or whatever else; the danger is picking something standard like 0 dBu that some phones could possibly not even reach). Don't just use whatever the max volume is, especially since that's into clipping territory for some phones. People don't scale their playback levels by how much power the electronics is capable of handling. I hope. Referencing a fixed level is more fair.
3. Please do keep reporting which phones run into clipping (and at what load) at volume settings at max or less. Also what some nonstandard settings like Beats Mode do.
4. Make careful distinction of THD with headphones as load and as not. If not loading with headphones-level impedance that is mostly testing the performance when hooked up to say a speaker system with a patch cable, which I don't think many people are doing these days.
5. When reporting maximum level, standardize to point of say 1% THD (or max volume, whichever comes first). Also note if headphones are used or not. It'd be meaningless to quote maximum levels far past the point of clipping.
6. If you have time, see if you can coax and measure some bad behavior out of the phone by using Wi-Fi, Bluetooth, LTE, etc. simultaneously, maybe some CPU/GPU load and seeing if that causes audio issues. Honestly, glitchy or cackling playback are far greater issues to audio quality than looking at 0.3 vs. 1 dB dips in frequency response at 19 kHz or something like that. Or output power levels most people don't need.