The AMD Ryzen 5 1600X vs Core i5 Review: Twelve Threads vs Four at $250
by Ian Cutress on April 11, 2017 9:00 AM ESTTest Bed Setup
As per our processor testing policy, we take a premium category motherboard suitable for the socket, and equip the system with a suitable amount of memory running at the manufacturer's maximum supported frequency. This is also typically run at JEDEC subtimings where possible. It is noted that some users are not keen on this policy, stating that sometimes the maximum supported frequency is quite low, or faster memory is available at a similar price, or that the JEDEC speeds can be prohibitive for performance. While these comments make sense, ultimately very few users apply memory profiles (either XMP or other) as they require interaction with the BIOS, and most users will fall back on JEDEC supported speeds - this includes home users as well as industry who might want to shave off a cent or two from the cost or stay within the margins set by the manufacturer. Where possible, we will extend out testing to include faster memory modules either at the same time as the review or a later date.
| Test Setup | |
| Processor | AMD Ryzen 5 1600X (6C/12T, 3.6G, 95W) AMD Ryzen 5 1500X (4C/8T, 3.5G, 65W) |
| Motherboards | ASUS Crosshair VI Hero |
| Cooling | Noctua NH-U12S SE-AM4 |
| Power Supply | Corsair AX860i |
| Memory | Corsair Vengeance DDR4-3000 C15 2x8GB |
| Memory Settings | DDR4-2400 C15 |
| Video Cards | MSI GTX 1080 Gaming X 8GB ASUS GTX 1060 Strix 6GB Sapphire Nitro R9 Fury 4GB Sapphire Nitro RX 480 8GB Sapphire Nitro RX 460 4GB (CPU Tests) |
| Hard Drive | Crucial MX200 1TB |
| Optical Drive | LG GH22NS50 |
| Case | Open Test Bed |
| Operating System | Windows 10 Pro 64-bit |
Hardware
We must thank the following companies for kindly providing hardware for our multiple test beds. Some of this hardware is not in this test bed specifically, but is used in other testing.
Thank you to Sapphire for providing us with several of their AMD GPUs. We met with Sapphire back at Computex 2016 and discussed a platform for our future testing on AMD GPUs with their hardware for several upcoming projects. As a result, they were able to sample us the latest silicon that AMD has to offer. At the top of the list was a pair of Sapphire Nitro R9 Fury 4GB GPUs, based on the first generation of HBM technology and AMD’s Fiji platform. As the first consumer GPU to use HDM, the R9 Fury is a key moment in graphics history, and this Nitro cards come with 3584 SPs running at 1050 MHz on the GPU with 4GB of 4096-bit HBM memory at 1000 MHz.
Further Reading: AnandTech’s Sapphire Nitro R9 Fury Review
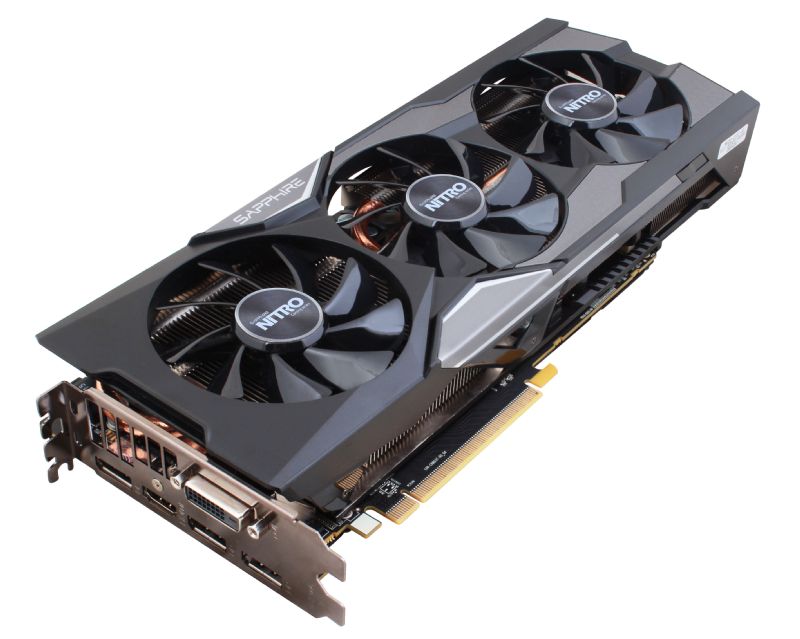
Following the Fury, Sapphire also supplied a pair of their latest Nitro RX 480 8GB cards to represent AMD’s current performance silicon on 14nm (as of March 2017). The move to 14nm yielded significant power consumption improvements for AMD, which combined with the latest version of GCN helped bring the target of a VR-ready graphics card as close to $200 as possible. The Sapphire Nitro RX 480 8GB OC graphics card is designed to be a premium member of the RX 480 family, having a full set of 8GB of GDDR5 memory at 6 Gbps with 2304 SPs at 1208/1342 MHz engine clocks.
Further Reading: AnandTech’s AMD RX 480 Review
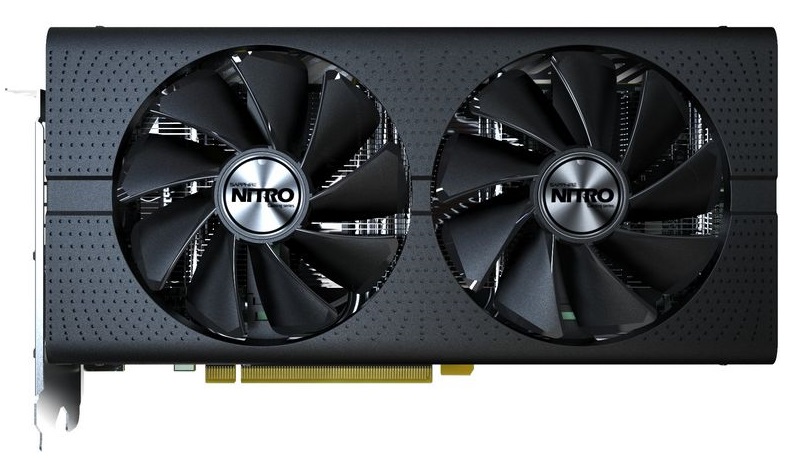
With the R9 Fury and RX 480 assigned to our gaming tests, Sapphire also passed on a pair of RX 460s to be used as our CPU testing cards. The amount of GPU power available can have a direct effect on CPU performance, especially if the CPU has to spend all its time dealing with the GPU display. The RX 460 is a nice card to have here, as it is powerful yet low on power consumption and does not require any additional power connectors. The Sapphire Nitro RX 460 2GB still follows on from the Nitro philosophy, and in this case is designed to provide power at a low price point. Its 896 SPs run at 1090/1216 MHz frequencies, and it is paired with 2GB of GDDR5 at an effective 7000 MHz.

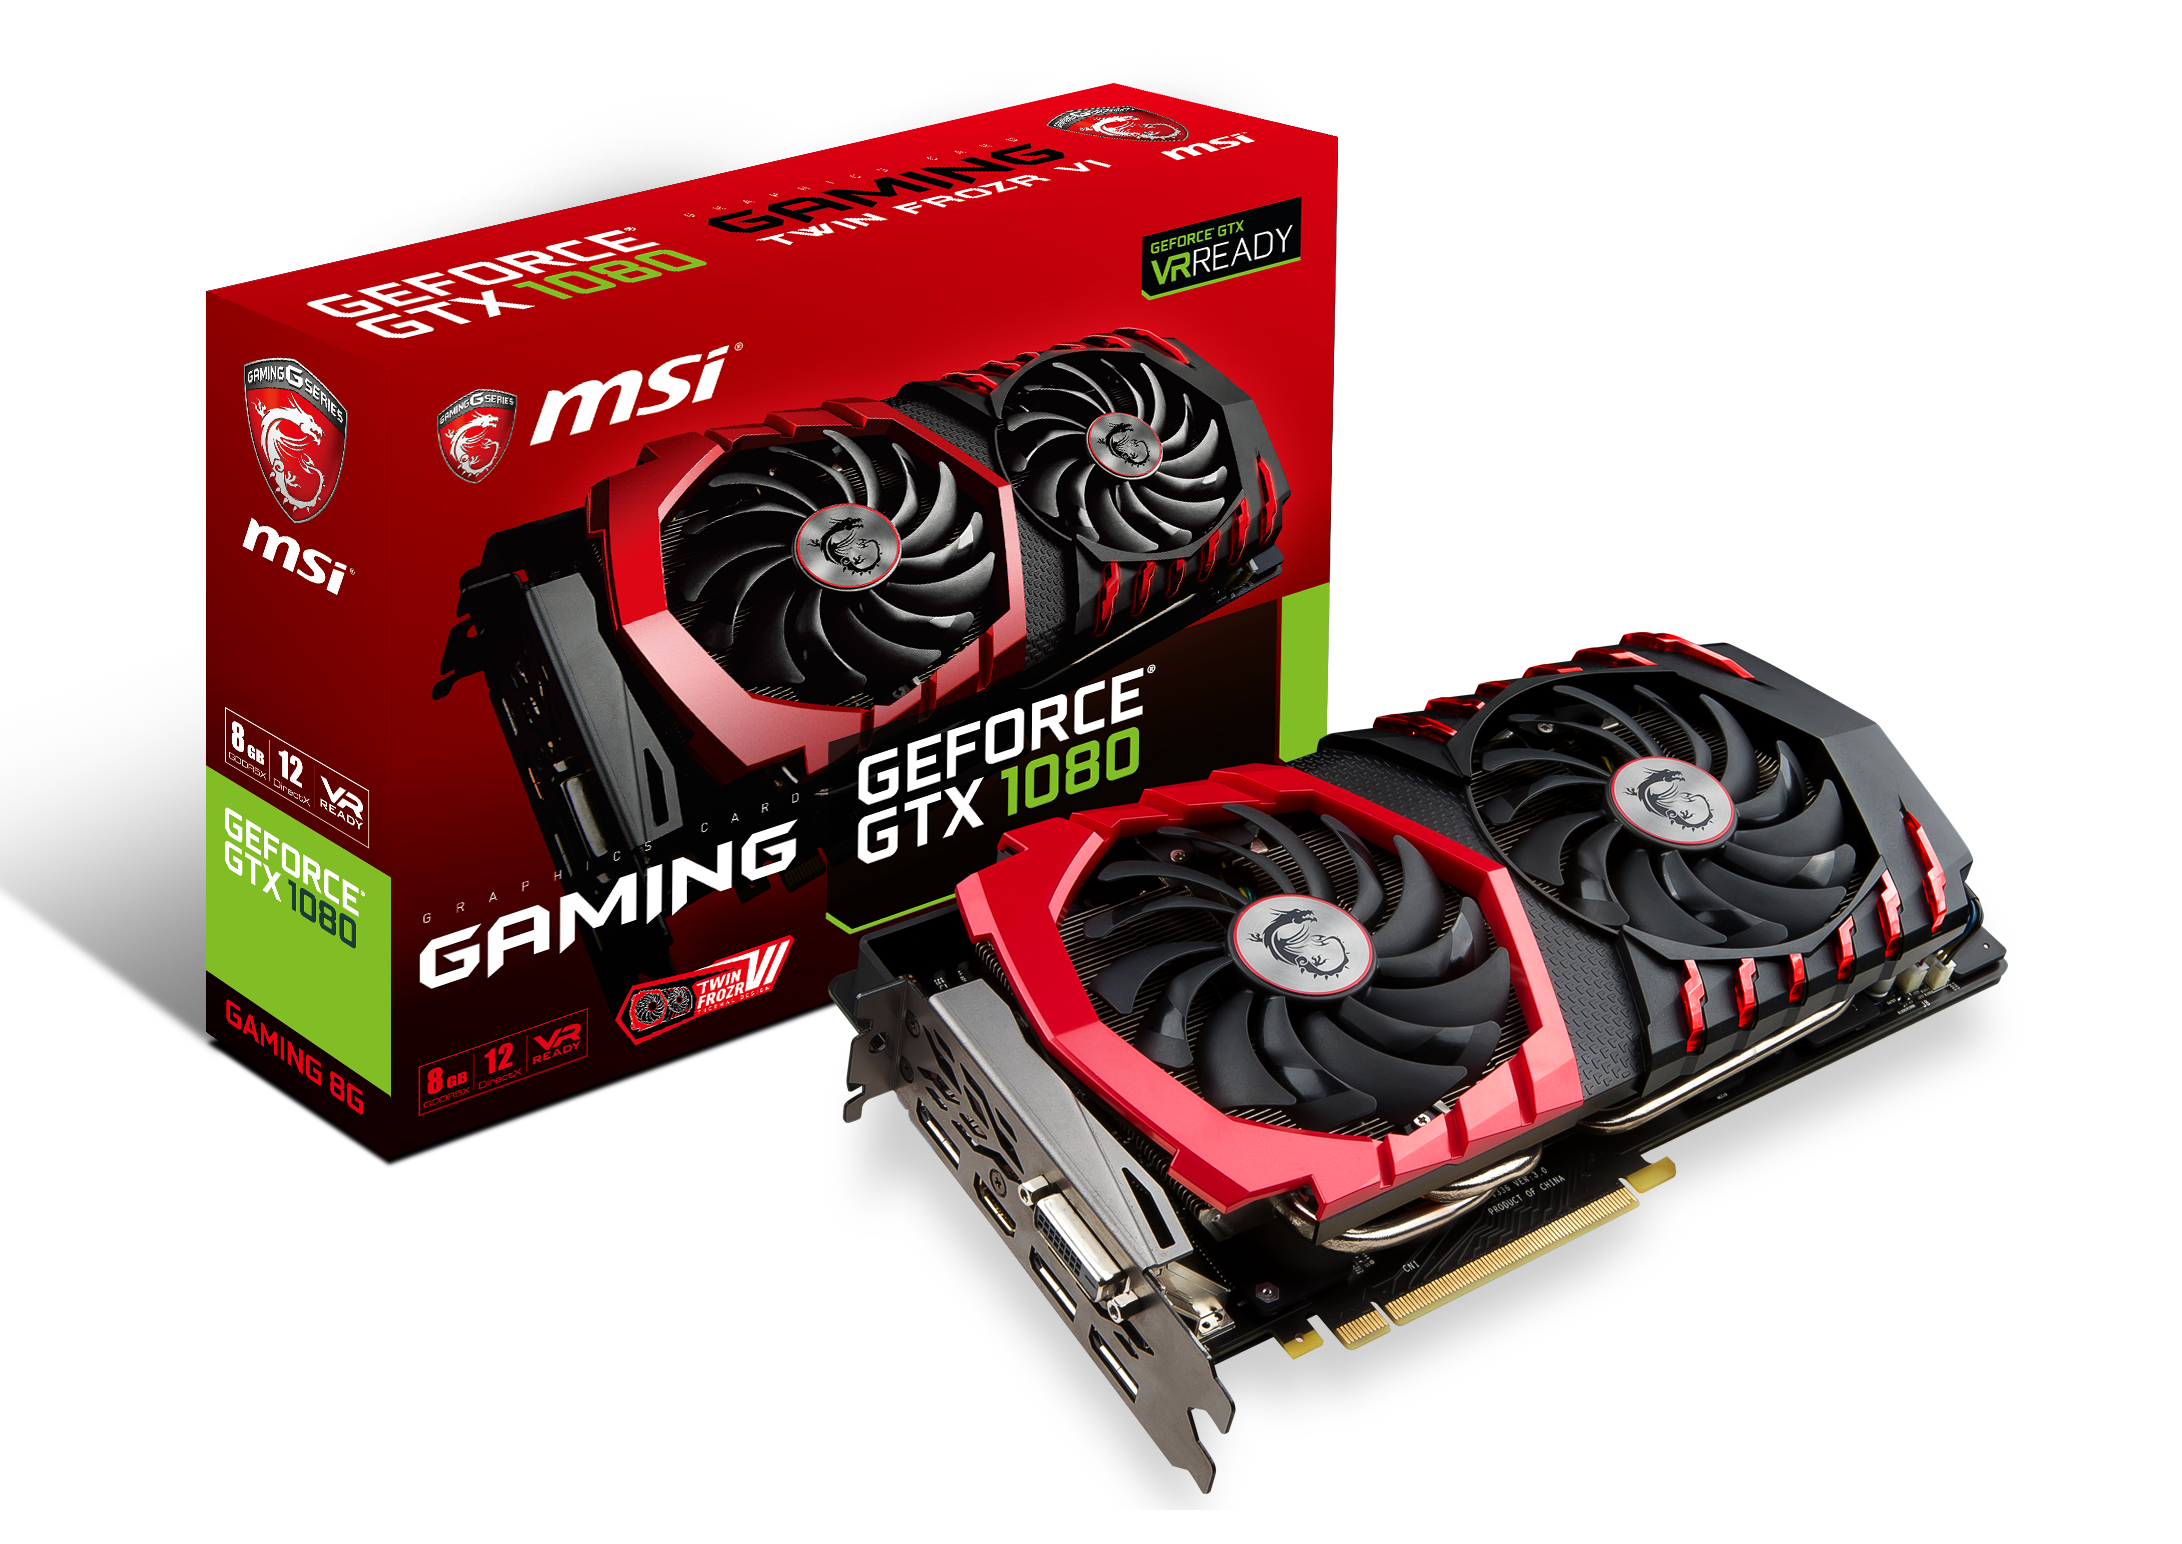
We must also say thank you to MSI for providing us with their GTX 1080 Gaming X 8GB GPUs. Despite the size of AnandTech, securing high-end graphics cards for CPU gaming tests is rather difficult. MSI stepped up to the plate in good fashion and high spirits with a pair of their high-end graphics. The MSI GTX 1080 Gaming X 8GB graphics card is their premium air cooled product, sitting below the water cooled Seahawk but above the Aero and Armor versions. The card is large with twin Torx fans, a custom PCB design, Zero-Frozr technology, enhanced PWM and a big backplate to assist with cooling. The card uses a GP104-400 silicon die from a 16nm TSMC process, contains 2560 CUDA cores, and can run up to 1847 MHz in OC mode (or 1607-1733 MHz in Silent mode). The memory interface is 8GB of GDDR5X, running at 10010 MHz. For a good amount of time, the GTX 1080 was the card at the king of the hill.
Further Reading: AnandTech’s NVIDIA GTX 1080 Founders Edition Review
Thank you to ASUS for providing us with their GTX 1060 6GB Strix GPU. To complete the high/low cases for both AMD and NVIDIA GPUs, we looked towards the GTX 1060 6GB cards to balance price and performance while giving a hefty crack at >1080p gaming in a single graphics card. ASUS lent a hand here, supplying a Strix variant of the GTX 1060. This card is even longer than our GTX 1080, with three fans and LEDs crammed under the hood. STRIX is now ASUS’ lower cost gaming brand behind ROG, and the Strix 1060 sits at nearly half a 1080, with 1280 CUDA cores but running at 1506 MHz base frequency up to 1746 MHz in OC mode. The 6 GB of GDDR5 runs at a healthy 8008 MHz across a 192-bit memory interface.
Further Reading: AnandTech’s ASUS GTX 1060 6GB STRIX Review

Thank you to Corsair for providing us with AX860i PSUs.
Thank you to Crucial for providing us with MX200 SSDs.
Thank you to ASRock for providing us with Gaming G10 Routers.
Thank you to Silverstone for providing us with Intel CPU Coolers, Fans and HDMI Cables.


254 Comments
View All Comments
Phiro69 - Tuesday, April 11, 2017 - link
Thank you Ian!Maybe at some point as part of your benchmark description you have a url to a page showing basic (e.g. exactly the level of information you provided above but not step by step hand holding) benchmark setup instructions. I know I wonder if I've configured my builds correctly when I put together new systems; I buy the parts based on benchmarks but I don't ever really validate they perform at that level/I have things set correctly.
qupada - Tuesday, April 11, 2017 - link
I was curious about this too. Obviously a direct comparison between your Windows test and my Linux one is going to be largely meaningless but I felt the need to try anyway. Since Linux is all I have, this is what we get.My Haswell-EP Xeon E5-1660v3 - approximately an i7-5960X with ECC RAM, and that CPU seems to be oft-compared to the 1800X you have put in your results - clocks in at 78:36 to compile Chromium (59.0.3063.4), or 18.31 compiles per day (hoorah for the pile of extra money I spent on it resulting in such a small performance margin). However that's for the entire process, from unpacking the tarball, compiling, then tarring and compressing the compiled result. My machine is running Gentoo, it was 'time emerge -OB chromium' (I didn't feel like doing it manually to get just the compile). Am I reading right you've used the result of timing the 'ninja' compile step only?
I only ask because there definitely could be other factors in play for this one - for the uninitiated reading this comment, Chromium is a fairly massive piece of software, the source tar.xz file for the version I tried is 496MB (decompressing to 2757MB), containing around 28,000 directories and a shade under 210,000 files. At that scale, filesystem cache is definitely going to come into play, I would probably expect a slightly different result for a freshly rebooted machine versus one where the compile was timed immediately after unpacking the source code and it was still in RAM (obviously less of a difference on an SSD, but probably still not none).
It is an interesting test metric though, and again I haven't done this on WIndows, but there is a chunk in the middle of the process that seems to be single-threaded on a Linux compile (probably around 10% of the total wall clock time), so it is actually quite nice that it will benefit from both multi-core and single-core performance and boost clocks.
Also with a heavily multi-threaded process of that sort of duration, probably a great test of how long you get before thermal throttling starts to hurt you. I have to admit I'm cheating a bit by watercooling mine (not overclocked though) so it'll happily run 3.3GHz on a base clock of 3.0 across all eight cores for hours on end at around ~45°C/115°F.
rarson - Tuesday, April 11, 2017 - link
14393.969 was released March 20th, any reason you didn't use that build?Ian Cutress - Friday, April 14, 2017 - link
Because my OS is already locked down for the next 12-18 months of testing.Konobi - Tuesday, April 11, 2017 - link
I don't know what's up with those FPS number in rocket league 1080p. I have ye olde FX-8350 @ 4.8GHz and a GTX 1070 @ 2.1GHz and I get 244fps max and 230FPS average at 1080p Ultra.Ian Cutress - Tuesday, April 11, 2017 - link
I'm running a 4x4 bot match on Aquadome. Automated inputs to mimic gameplay and camera switching / tricks, FRAPS over 4 minutes of a match.jfmonty2 - Wednesday, April 12, 2017 - link
Why Aquadome specifically? It's been criticized for performance issues compared to most of the other maps in the game, although the most recent update has improved that.Ian Cutress - Friday, April 14, 2017 - link
On the basis that it's the most strenuous map to test on. Lowest common denominator and all that.Adam Saint - Tuesday, April 11, 2017 - link
"Looking at the results, it’s hard to notice the effect that 12 threads has on multithreaded CPU tests"Perhaps you mean *not* hard to notice? :)
coder543 - Tuesday, April 11, 2017 - link
I agree. That was also confusing.